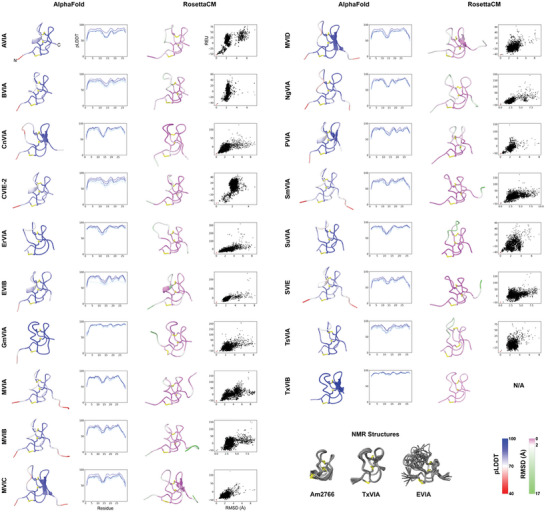
Figure 2.

Results of the modeling pipeline for all peptides. Disulfide bonds are highlighted in yellow. From left: best‐scoring model produced by AlphaFold, colored by per‐residue pLDDT score; a plot of pLDDT per residue for the models generated by AlphaFold. Models with higher overall pLDDT scores are in darker blue; the best‐scoring model produced by RosettaCM, colored by per‐residue root‐mean‐square deviation (RMSD) to representatives of the top 5 best‐scoring clusters; score‐RMSD funnel plot for all 5000 decoys produced by RosettaCM, with score measured in Rosetta energy units (REU) and RMSD calculated by distance to the lowest‐energy model, and with the displayed model indicated in red; Below: experimentally‐determined NMR ensembles used as templates in this study for RosettaCM modeling. RMSD and pLDDT color bars are shown bottom right.
