
Figure 4.
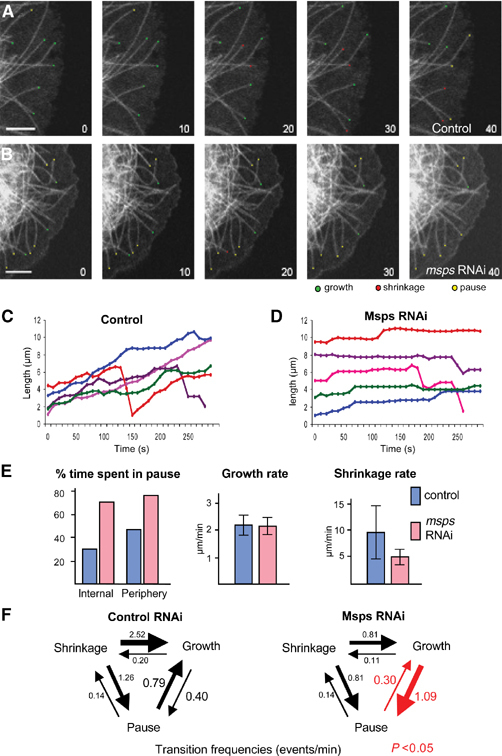
Extensive microtubule pausing is induced by Msps depletion. (A) Time-lapse images of microtubule plus ends in control GFP-tubulin cells. Growing, shrinking and pausing ends were marked with green, red and yellow dots. Numbers at the bottom left represent time in seconds. Microtubules show dynamic instability with occasional pauses. Bar=10 μm. (B) The dynamics of microtubule plus ends in cells partially depleted of Msps. Cells were observed 48 h after the addition of dsRNA. Microtubule plus ends exhibit a prolonged pausing. (C) Life history plots of microtubules in control cells. Microtubule plus ends show persistent growth and occasional shrinkages with some pausing. (D) Life history plots of microtubules in cells partially depleted of Msps. Microtubules spent most of their time pausing with occasional growth and shrinkage. (E) Parameters of microtubule dynamics. Times spent in pause are shown in percentages. In control cells, microtubule plus ends near the cell periphery (within 0.2 μm) spent more time in pause than those inside of the cell (internal). In both cases, Msps partial depletion increased time spent in pause. Average growth and shrinkage rates were shown with standard deviations (lines). (F) Transition frequencies between three microtubule states: growth, shrinkage and pause. Only the transition frequencies marked with red arrows and numbers were significantly different in Msps-depleted cells from those of control cells (P<0.05). The transition from pause to growth significantly decreased and the transition from growth to pause increased. Transition frequencies from shrinkage to growth or pause may be increased, but they were not proved to be statistically significant due to small sample size of time microtubules spent in shrinkage.