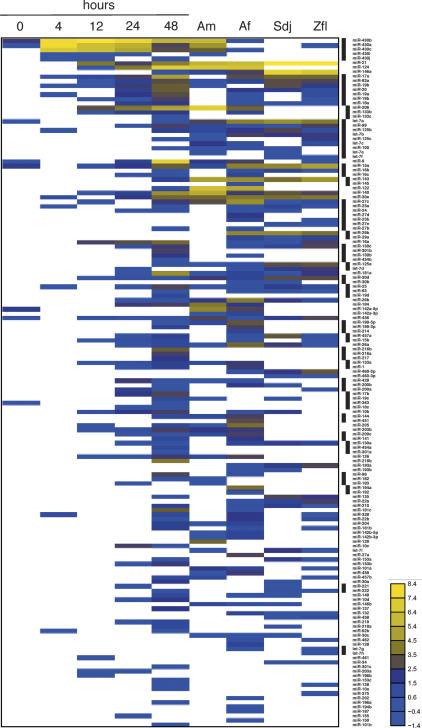
Figure 1.
Graphic representation of the miRNA profile. The profile is based on clone numbers and is scaled such that the total number of clones from each RNA sample (Supplementary Table 2) is the same and arbitrarily set at 1000 clones. This adjustment corrects for the difference in the number of clones at different stages assuming that the total small RNA composition of each pool is constant. The profile shows log2 of normalized miRNA clone numbers. The black bars to the right identify miRNAs that reside in miRNA gene clusters (Supplementary Table 5), and they were grouped together because they are assumed to be coexpressed.

