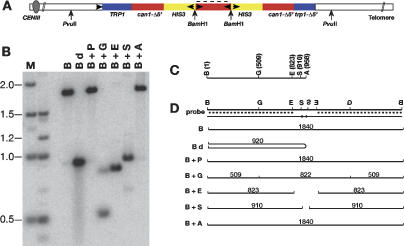
Figure 2.
Southern blot analysis of a palindromic gene duplication event. (A) Schematic of the palindromic molecule showing the location of the BamH1 (B) and PvuII (P) sites. (B) Southern blot analysis of BamH1-digested DNA. (Bd) BamH1-digested DNA that was denatured by boiling prior to electrophoresis; (G) BglI; (E) EcoR1; (S) BstEII; (A) AvaII. (A,D) The blot was probed with unique sequences from the 3′ end of the CAN1 gene (dotted lines). (C) Location of restriction sites in relevant region of the native CAN1 gene. (D) Schematic showing interpretation of the Southern blot shown in panel B.

