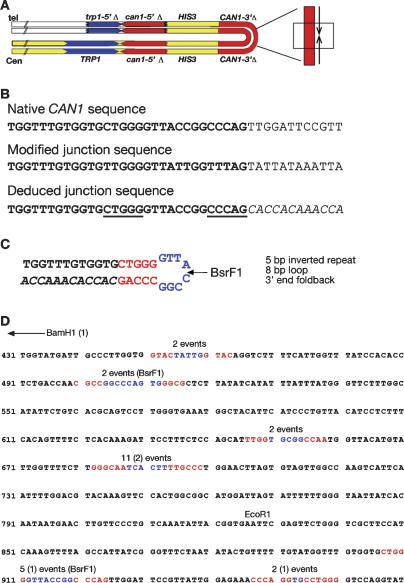
Figure 3.
DNA sequence analysis of palindromic junctions. (A) Schematic of a palindromic event with the location of the region sequenced shown by the boxed region. (B) Sequence analysis of the same event analyzed in Figure 2. (Top) Sequence of the relevant region of the native CAN gene. (Center) Bisulfite-modified sequence of the junction. (Bottom) Deduced junction sequence. Sequence in italics diverges from the native sequence. Underlined sequences indicate short inverted repeats preceding the point of divergence. (C) Interpretation of sequence analysis with inverted repeats shown in red and loop region shown in blue. BsrF1 indicates the site used for vectorette PCR analysis. (D) Summary of sequence from 24 independent junctions. Sequence shown is a portion of the CAN1 gene, where the BamH1 site of the starting substrate is at position 1 (not shown). The end point of each different palindromic junction is shown with the stem regions highlighted in red and the loop region highlighted in blue. For each junction the homology ends at the second inverted repeat sequence followed immediately by the complement to the sequence preceding the first inverted repeat (as drawn in C). The shortest palindrome is the first sequence highlighted and the longest palindrome is the last sequence highlighted. The number of independent events mapping to each of the six junctions is shown above the sequence. Junction sequences from rad50Δ cells are noted in parentheses, the remaining 20 events are derived from sae2Δ cells. EcoR1 defines the site at which homology to the can1-5′Δ allele begins. BsrF1 indicates the location of the sites used for verifying the relevant events by vectorette PCR.

