Figure 1.
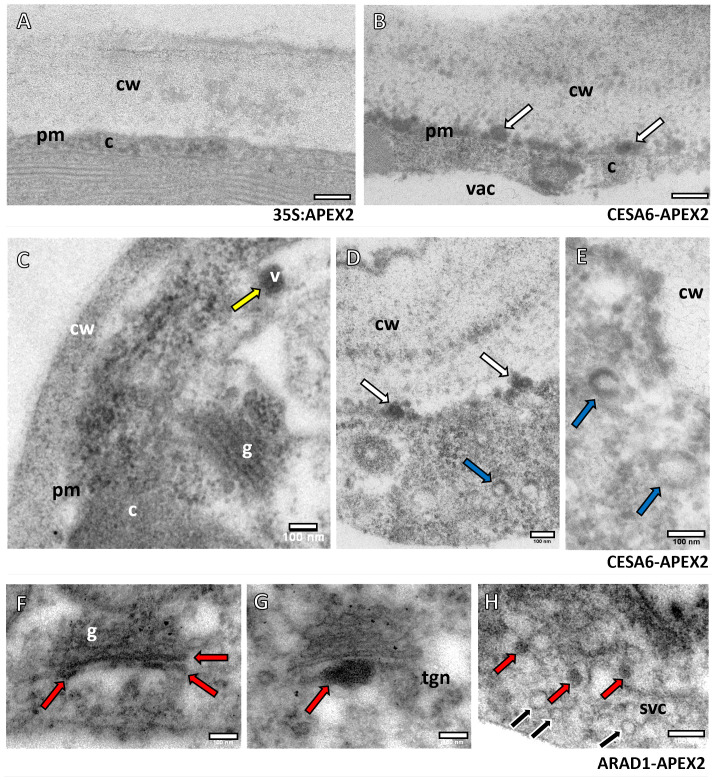
Subcellular localisation of APEX2-AtCESA6 and NaARADL1-APEX2 constructs using TEM. (A) The control construct 35S:APEX2 with no electron dense labelling adjacent to the cell wall (cw). (B) The APEX2-AtCESA6 sample with electron dense labelling at a comparative region (white arrows). (C–E) Further labelling of the APEX2-AtCESA6 construct in vesicles (v), adjacent to the cell wall (white arrows), and vesicles with what appears to be a translucent centre with electron dense labelling around the outside (blue arrows). (F–H) The NaARADL1-APEX2 labelling showed electron dense labelling in the trans-Golgi, the TGN and in vesicles in the cytoplasm (red arrows). Multiple, non-labelled vesicles (black arrows) were observed in the same region as NaARADL1-APEX2 positive vesicles in a possible SVC. cw, Cell wall; c, cytoplasm; vac, vacuole; v, vesicle; g, Golgi Apparatus; tgn, trans-Golgi network; svc, secretory vesicle cluster. Scale bars = 100 nm.

