
Figure 1.
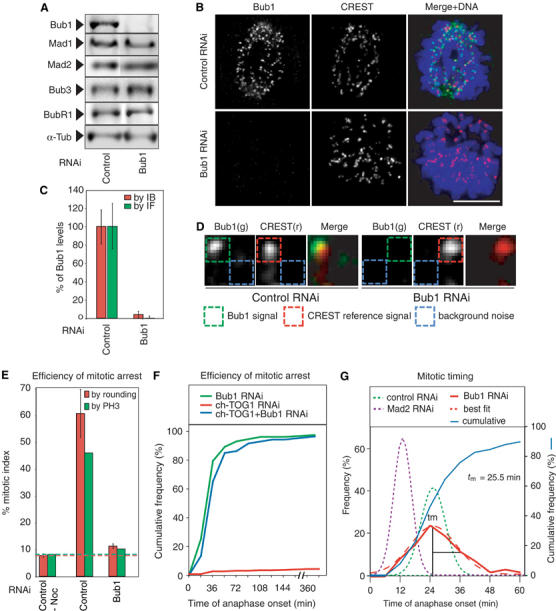
Bub1 depletion abrogates the spindle checkpoint in HeLa cells. (A) Immunoblots of lysates from cells transfected with siRNA against Lamin A (a negative control) or Bub1 and probed with antibodies as indicated. (B) Immunofluorescence images of prometaphase cells following transfection with Lamin A or Bub1 siRNA and stained with either Bub1 or CREST anti-sera. Scale bar: 10 μm. (C, D) Quantification of Bub1 levels in whole-cell lysates by immunoblotting (red bars) or on prometaphase kinetochores by immunofluorescence (green bars). Error bars show standard error of the mean (s.e.m.) from repeat determinations in multiple cells. Bub1 levels were determined from deconvolved 3D reconstructions. The Bub1 intensity (green) was determined relative to a CREST reference (red) and corrected for background noise (blue). See Supplementary data for details. Each box has a dimension of 0.25 × 0.25 μm. (E) Mitotic index of untransfected and siRNA-transfected cells, as indicated, treated with 100 ng/ml nocodazole for 16 h. The fraction of mitotic cells was determined by cell rounding under phase contrast microscopy (red) or FACS of phospho-histone H3-positive cells (green). Red and green dotted lines show comparable values from unperturbed cycling cells. Error bars represent s.e.m. (F) Cumulative frequency plots of anaphase times in siRNA-treated cells, as indicated, with NBD=T0, as determined from live-cell movies. Note that Bub1 depletion bypasses a mitotic arrest induced by ch-TOG1 depletion (blue lines). (G) Frequency distribution of anaphase times in siRNA-treated cells as indicated; tm denotes the peak time (mode) of the distribution. Mad2 data were derived from Meraldi et al (2004).