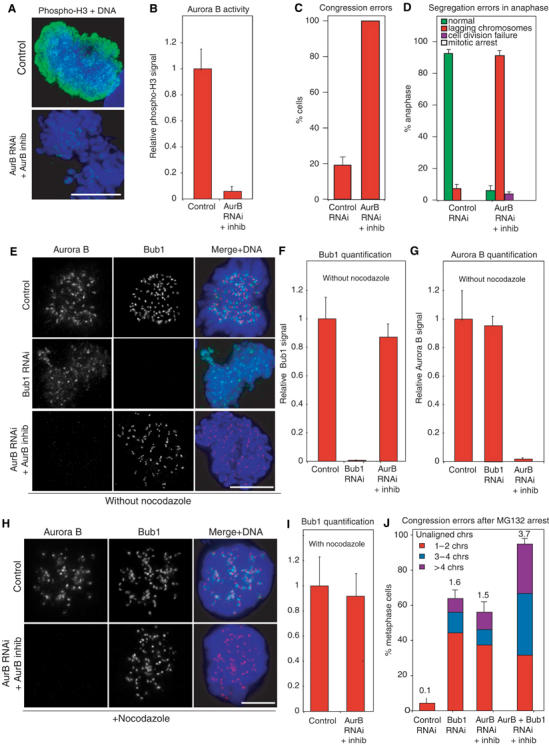
Figure 6.

Bub1 and Aurora B act independently of each other. (A, B) Quantification of histone H3 phosphorylation following Aurora B inhibition, as a measure of Aurora B activity. Cells were stained with anti-phospho-H3 antibodies (green) and DAPI (blue) and the overall intensity measured in 10 prometaphase cells each. Error bars indicate s.e.m. Scale bar: 10 μm. (C, D) Fraction of cells with congression and segregation errors (see Figures 1 and 2) following Aurora B inhibition. (E) Immunofluorescence of cells following siRNA transfection as indicated and stained with DAPI (blue), anti-Bub1 antibodies (red) and anti-Aurora B antibodies (green). Scale bar: 10 μm. (F, G) Quantification by immunofluorescence of Aurora B and Bub1 levels on prometaphase kinetochores following RNAi (as in Figure 1). Error bars indicate s.e.m. (H) Immunofluorescence of nocodazole-treated cells following siRNA transfection as indicated, and stained as in (E). Scale bar: 10 μm. (I) Quantification of Bub1 levels on kinetochores of nocodazole-treated cells as in (F). (J) Fraction of cells with maloriented and misaligned chromatids following RNAi as assayed in MG132-arrested cells. Chromatids were scored as maloriented or misaligned as described in Figure 3.
