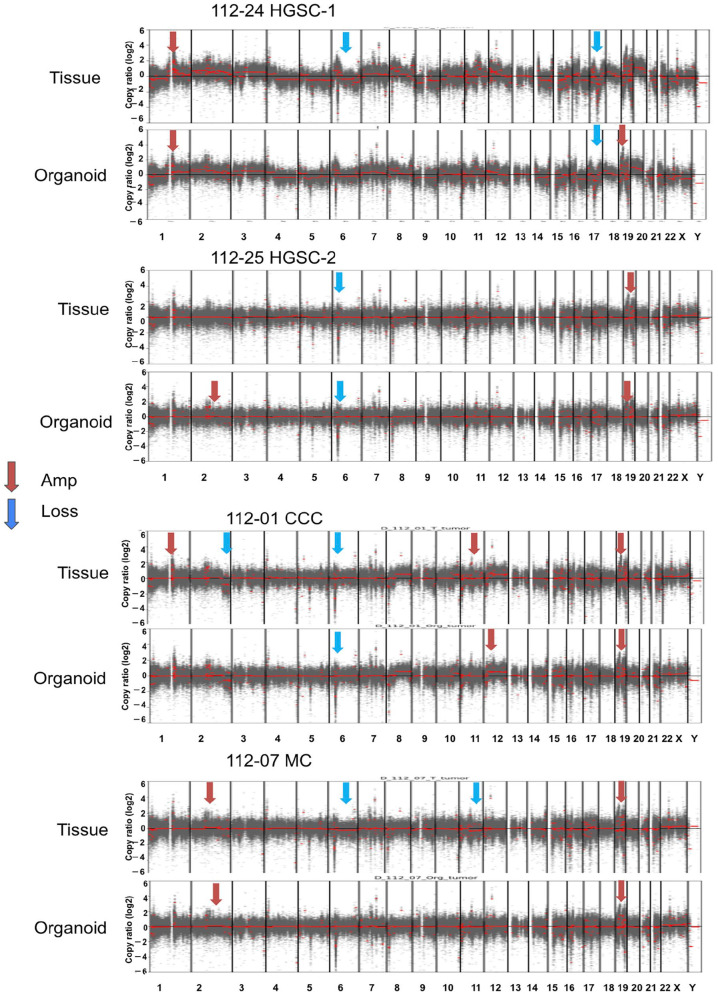
Figure 6.
We created copy number variation (CNV) profiles for four instances and assessed the correlations (Pearson’s r) between tumor tissue and organoid samples. These CNV profiles were generated using a comprehensive cancer panel covering 1,053 genes. In the plot, regions with amplification are depicted in red, while areas with loss are shown in blue. T: tumor, O: organoid samples. HGSC: high-grade serous carcinoma, CCC: clear cell carcinoma, MC: mucinous carcinoma.

