
Figure 4.
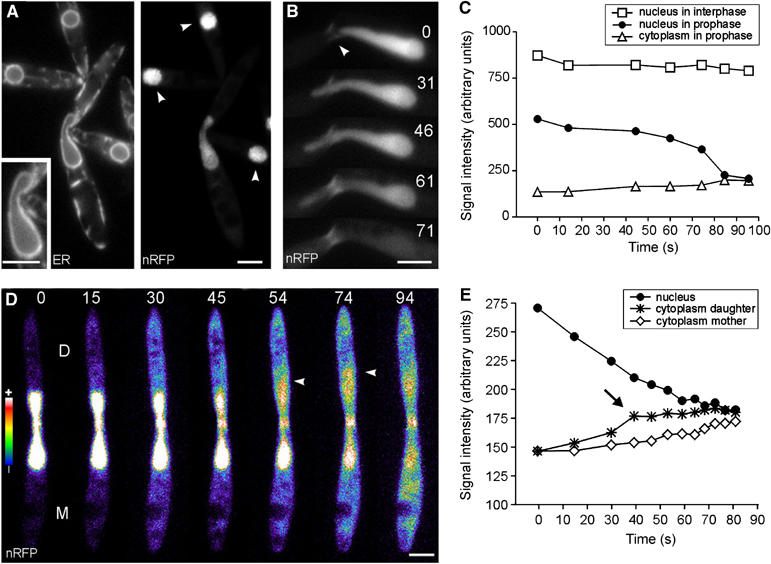
Release of a nucleus-targeted red fluorescent protein. (A) Elongated nuclei that reach into the daughter cell contained ∼30% less nRFP, although the NE appeared to be intact (inset). Arrowheads indicate neighbouring interphase nuclei. ER: ER-GFP; nRFP: nRFP. Bar: 3 μm. (B) A nuclear extension reaches into the daughter cell and rapidly releases the RFP fusion protein (nRFP). For unknown reasons, the neck also shows fluorescent staining (arrowhead). Bar: 3 μm. (C) Kinetic profile of nRFP fluorescence intensity in an interphase nucleus (square), in the basal region of the prophase nucleus (filled circles) and in the cytoplasm of the same cell (triangle). Note that the nucleus is permeable for nRFP at t=0 s (compare with panel A). While the nRFP signal in interphase remains fairly constant, the fusion protein continuously leaks out of the prophase nucleus until it is rapidly released at t=60 s. (D) Shortly before breakage, the envelope becomes permeable and releases some RFP fusion protein into the daughter cell (D; nRFP intensity is given in pseudocolours: blue indicates weak signal intensity, yellow to white is indicative of a strong signal). Rapid release of nRFP occurs with a first wave into the daughter cell (arrowhead at 54 and 74 s) and subsequent diffusion into the mother cell (M; arrowhead at 94 s). Elapsed time is given in seconds. Bar: 3 μm. (E) At t=0 s, the intensity of cytoplasmic nRFP in the daughter cell (star) is the same as in the mother cell (rhombus). However, in late stages, a peak of nRFP is found at the front of the extension (arrrow), indicating that the breakage of the NE occurs at the SPBs within the daughter cell. Supplementary movie for panel D is given on the EMBO website.