Figure 6.
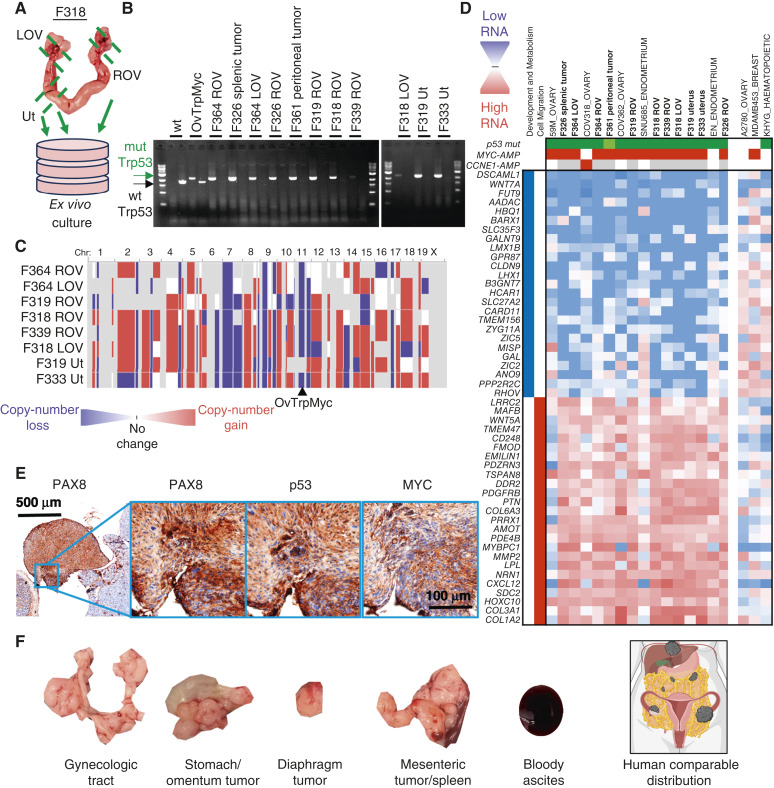
CNAs, transcriptomics, and tumorigenicity of extracted OvTrpMyc tumor cells. A, Dissection diagram for ex vivo expansion. Gynecologic tract for mouse F318 is shown. B, LOH was observed by PCR of the Trp53 transgene (mutation) in isolated cells. C, Whole-genome CNA calls of tumor cells. Blue indicates copy-number loss, and red indicates copy-number gain. D, Transcriptomic profiling of OvTrpMyc cancer cells compared with human gynecologic cancer within the human CCLE. Header genes refer to mutation in p53 (green), MYC amplification (red), or CCNE1 amplification (red), shaded white if absent or gray if unknown. Nearest neighbor human cell lines comprise the cell lines shown. A2780, MDA-MB-453, and KHYG cell lines are shown as representative cell lines which have driver gene characteristics comparable with the mouse cell lines but clearly different transcriptional profiles. E, 8 × 10⁶ F339 ROV OvTrpMyc cell line cells were injected i.p. into a young OvTrpMyc female recipient mouse. The mouse lost weight, meeting euthanasia criteria after 54 days. IHC staining of a dissected tumor attached to the intestines is shown. F, Distribution of tumors found in F318 LOV i.p. syngeneic injected mice (5 × 10⁶ cells, 132 days) relative to a human image depiction of HGSOC metastatic spread. LOV, left ovary; ROV, right ovary; Ut, uterus.

