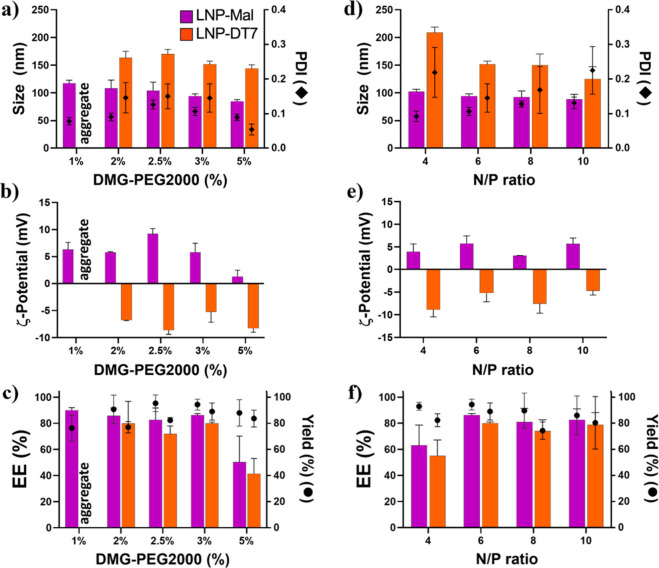
Figure 2.
Characterization of LNP-Mal and LNP-DT7 at different DMG-PEG2000 concentrations and N/P ratios. (a, b, and c) Size (intensity-weighted), ζ-potential, and EE% at different DMG-PEG2000 concentrations, respectively. (d, e, and f) Size (intensity-weighted), ζ-potential, and EE% at different N/P ratios, respectively. Data indicate mean ± SD of three replicates (see Table S1).

