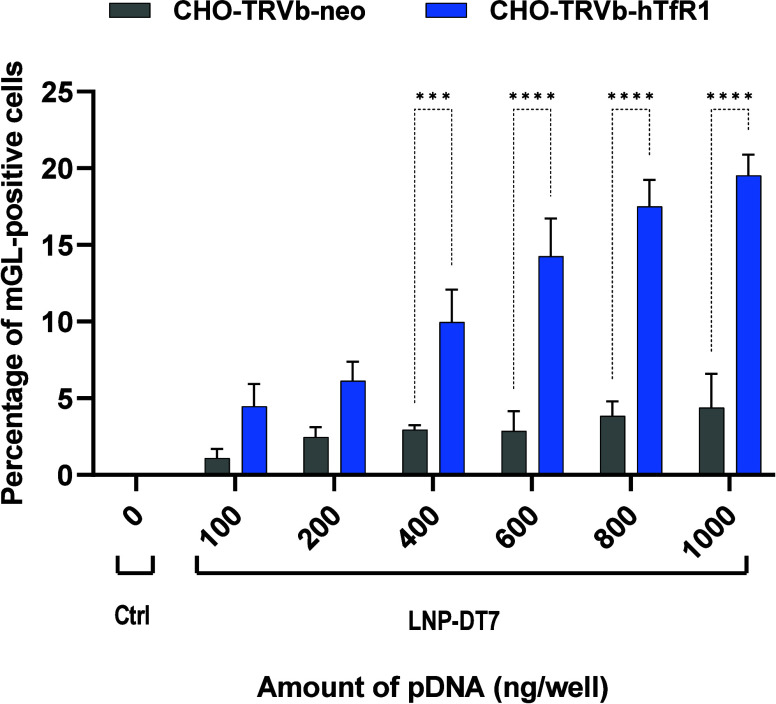
Figure 5.
Percentage of mGL-positive cells at different concentrations of pDNA. CHO-TRVb-neo and CHO-TRVb-hTfR1 cells separately transfected with 0, 100, 200, 400, 600, 800, and 1000 ng of mGL-pDNA encapsulated in LNP-DT7. The percentage of mGL transfected cells was evaluated by flow cytometry. Data were represented as mean ± SD of biological replicates (n = 3). Statistical analysis was performed by Bonferroni’s multiple comparisons test: ***p < 0.001; ****p < 0.0001.

