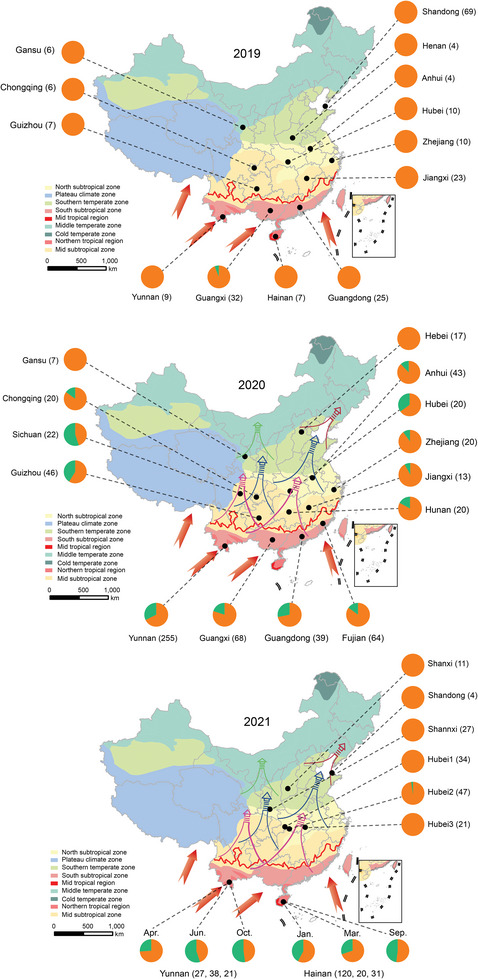
Figure 1.

Dynamics of FAW‐mR and FAW‐mC distribution in Spodoptera frugiperda across China during 2019–2021. Orange represents the percentage of FAW‐mR strain; green represent the percentage of FAW‐mC strain. The red line in the map represents northern boundary of winter‐breeding area. The arrows out the map represent the possible immigration route from neighboring countries. The arrows in the map indicate the sweeping orientation and areas. A–C) the pie chart north of the overwintering northern boundary shows the proportion of first occurrence of two strains in non‐overwintering area in 2019 and 2021, but not in 2020. The points in the map represent different sampled provinces. The number in bracket represents sample size.
