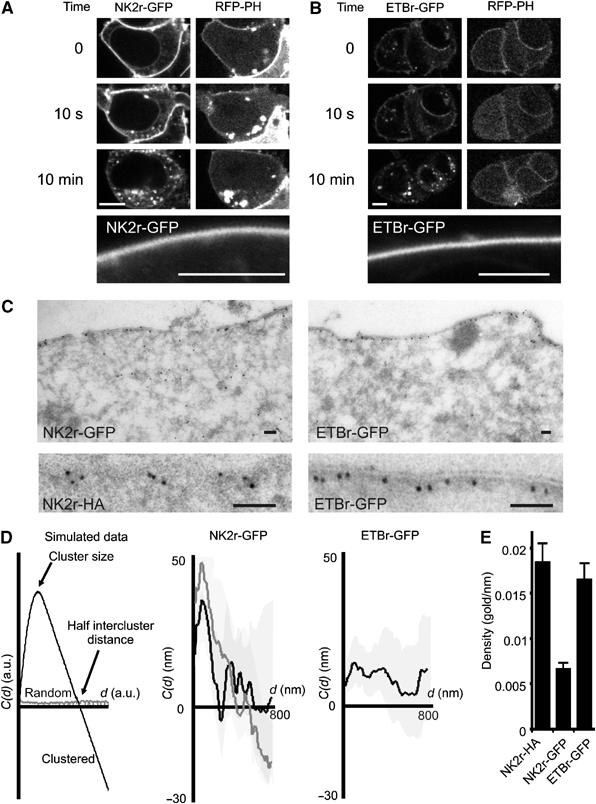
Figure 2.

Distribution of NK2r and ETBr at the plasma membrane. HEK293 cells were cotransfected with RFP-PH and with the GFP-tagged NKA (A) or ETB (B) receptor. Confocal images were acquired before, at 10 s, and at 10 min after receptor stimulation. Within 10 s of agonist addition, PLC is fully activated as deduced from the translocation of RFP-PH to the cytosol, whereas receptor internalization takes several minutes to complete. The lower panels show NK2r-GFP and ETBr-GFP at high magnification to illustrate lack of clustering at the light microscopical level in the absence of agonist. Scale bars, 5 μm. (C) (Left panels) EM micrograph of the localization of GFP-NK2r at the plasma membrane. The lower panel shows a similar result obtained with HA-tagged NK2r, using an antibody against the HA tag. (Right panels) Localization of GFP-ETBr by EM. Scale bars, 100 nm. (D) Cluster analysis of the distribution of gold particles from EM pictures, using a one-dimensional adaptation (see Materials and methods) of Ripley's K analysis. With randomly distributed particles, the cluster parameter C(d) is close to 0 for all cluster diameters d (left panel, gray line). In a clustered data set, for d increasing from 0, C(d) initially becomes positive (indicating over-representation of short distances in the data set), and subsequently crosses the x-axis to become negative. The location of the maximum predicts the average radius of the clusters, and the intersection with the x-axis indicates half of the intercluster distance (left panel, black line). Pooled results from cluster analyses for the NKA receptor (middle panel, black line) confirm strong clustering, whereas the ET receptor (right panel) is not clustered. Treatment of cells expressing NK2r with CD (middle panel, gray line) had little effect on overall clustering and the average cluster size was unaffected. The shaded regions indicate standard errors. (E) Expression levels (mean+s.e.) of HA- or GFP-tagged receptors used for the analysis in (D). Density (gold particles per nanometer membrane) was derived from EM micrographs.
