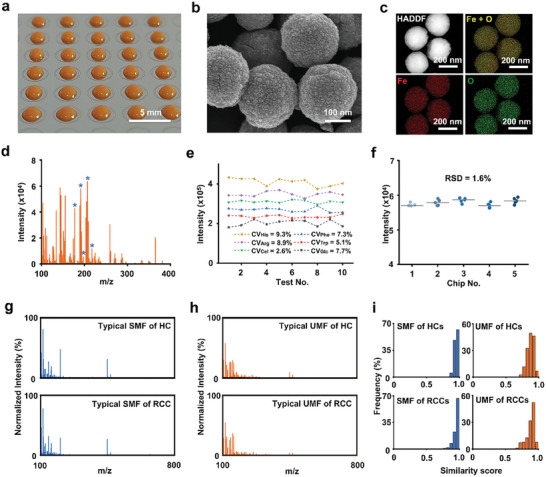
Figure 1.

Serum and urine metabolic fingerprints using the NPELDI‐MS platform. a) Digital image of the microarray depicts the printing of the matrix as orange regions on the chip, with a scale bar measuring 5 mm. b) Scanning electron microscopy (SEM) image displays surface cavities of nanoparticles, with a scale bar measuring 100 nm. c) The high‐angle annular dark‐field (HAADF) image and elemental mapping of the nanoparticles show Fe in red and O in green, with the scale bar measuring 200 nm. d) Salt and protein tolerance of the microarray (salt solution: 1 mm PBS; protein: 5 mg mL−1 bovine serum albumin (BSA)). Blue asterisks represent histidine (His), phenylalanine (Phe), arginine (Arg), glucose (Glc), and tryptophan (Trp) at the m/z peaks of 178, 188, 197, 203, and 227, respectively. e) CVs of intensities for histidine (His), phenylalanine (Phe), arginine (Arg), tryptophan (Trp), cellobiose (Cel), and glucose (Glc) in a standard mixture over ten tests. f) Microarray reproducibility of five chips for standard Glc (1 mg mL−1) intensity in five duplicates. g) Typical mass spectra of the serum metabolic fingerprint (SMF) for HC and RCC in the m/z range of 100–800 Da. h) Typical mass spectra of the urine metabolic fingerprint (UMF) for HC and RCC in the m/z range of 100–800 Da. i) Intragroup similarity scores for serum and urine metabolic fingerprints showed frequency distributions for both HC and RCC patient groups.
