
Figure 2.
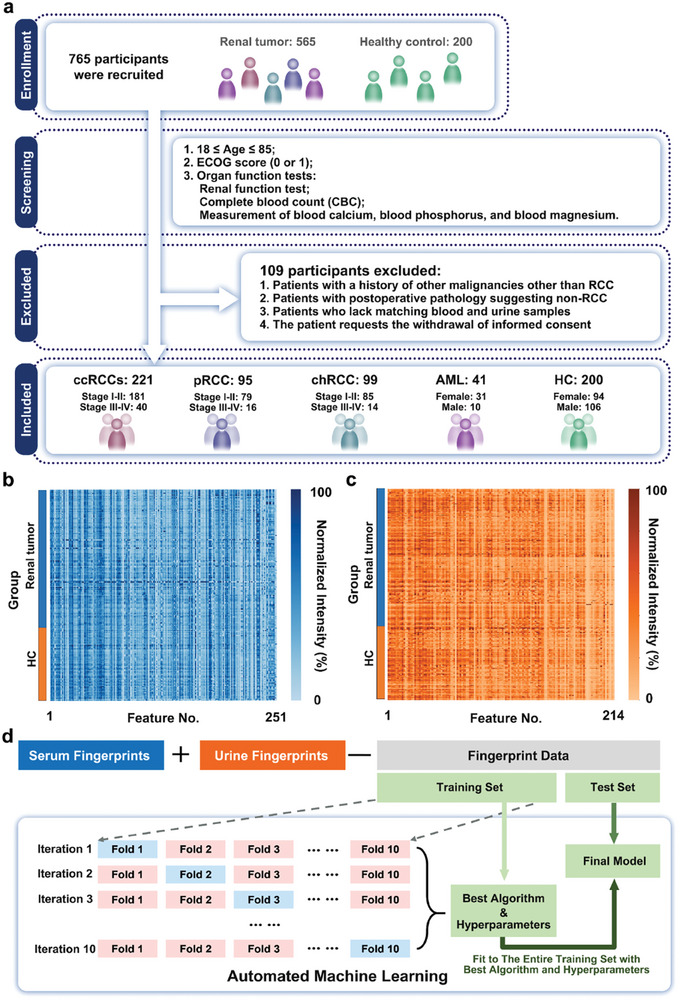
Cohort design and model optimization. a) Workflow summarizing the selection process, where 656 subjects were chosen from 765 subjects. b) SMF of 251 m/z features was extracted from the raw mass spectrometry data. The intensities were displayed using a color scale after logarithmic transformation. c) UMF, including 214 m/z features, was extracted from raw mass spectrometry data. The intensities were displayed using a color scale after logarithmic transformation. d) Workflow of training and evaluation of classification model via automated machine learning.