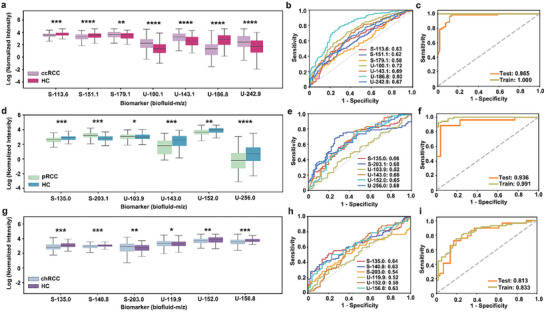
Figure 5.

Distribution and diagnostic performance of metabolic biomarkers for three subtypes of RCC. a–c) Biomarker panel for ccRCC: The beeswarm plot demonstrated differential expression of the seven metabolic biomarkers between HCs and ccRCC patients (three biomarkers for serum and four biomarkers for urine). Metabolite levels were presented as normalized intensities after undergoing logarithmic transformation. a); The ROC curves demonstrated the AUCs of each metabolic biomarker (AUC of 0.58–0.80) b); The ROC curves of the metabolic panel for train set and test set to distinguish HC and ccRCC patients c). d–f) Biomarker panel for pRCC: The beeswarm plot demonstrated differential expression of the six metabolic biomarkers between HCs and pRCC patients (two biomarkers for serum and four biomarkers for urine). Metabolite levels were presented as normalized intensities after undergoing logarithmic transformation. d); The ROC curves demonstrated the AUCs of every single metabolic biomarker (AUC of 0.52–0.68) e); The ROC curves of the metabolic panel for train and test sets to distinguish HCs and pRCC patients f). g–i) Biomarker panel for chRCC: The beeswarm plot demonstrated differential expression of the six metabolic biomarkers between HCs and chRCC patients (three features for serum and three features for urine). Metabolite levels were presented as normalized intensities after undergoing logarithmic transformation. g); The ROC curves demonstrated the AUCs of each metabolic biomarker (AUC of 0.52–0.64) h); The ROC curves of the metabolic panel for train set (dark khaki line, AUC = 0.813) and test set (orange line, AUC = 0.833) to distinguish HC and chRCC patients i). * p < 0.05, ** p < 0.01, *** p < 0.005, and **** p < 0.0001.
