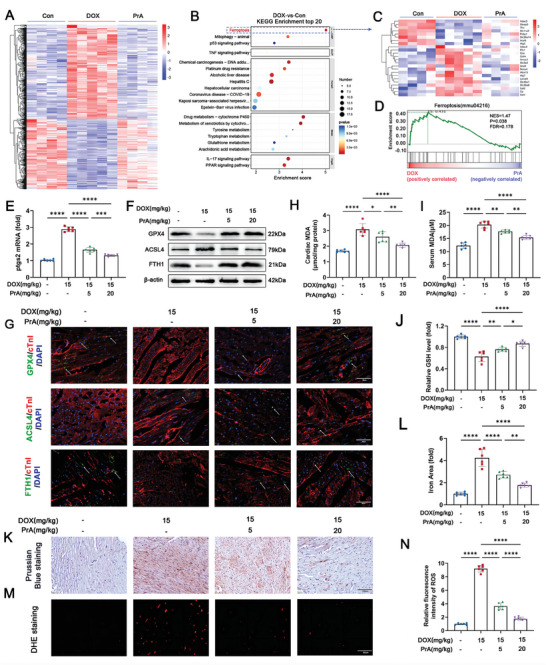
Figure 2.

PrA ameliorates DOX‐induced ferroptosis in heart tissue. A–D) RNA‐seq analysis reveals the DEGs in murine hearts from three groups: control (n = 4 per group), DOX (15 mg kg−1, i.p.; n = 5 per group), and DOX + PrA (20 mg kg−1, i.g.; n = 4 per group), as mentioned in Figure 1A. A) Heat map representing the significantly regulated genes detected in RNA‐seq analysis of murine heart tissue. Gene expressions were normalized with row Z‐score. B) KEGG pathway enrichment analysis in DOX‐treated murine heart compared with control murine heart. C) Heat map representing the ferroptosis‐related genes detected in RNA‐seq analysis of murine heart tissue. Gene expressions were normalized with row Z‐score. D) GSEA of regulated genes in DOX with PrA‐treated murine heart compared with DOX‐treated murine heart. E–N) Mice were randomly divided into four groups (n = 6 per group): control, DOX, DOX+PrA (5 mg kg−1), and DOX+PrA (20 mg kg−1). E) Relative mRNA levels of Ptgs2 in murine hearts. F) Cardiac protein expression of GPX4, ACSL4, and FTH1 were measured by immunoblotting. G) Representative images of cofluorescent immunohistochemistry staining for cTnT with GPX4 (green), ACSL4 (green), and FTH1 (green) in mice; the white arrows indicated positive areas. H) Cardiac MDA, I) serum MDA, and J) cardiac GSH levels were measured. K) Representative images and L) % area of Prussian blue staining with DAB enhancement (scale bar:100 µm). M,N) Representative images and quantifying fluorescent immunohistochemistry staining for DHE (scale bar: 20 µm). E,J,L,N) Some of the data was normalized. Summary data are presented as the mean ± SEM. Statistical significance was calculated using one‐way ANOVA with Tukey's multiple comparisons test. *p < 0.05, **p < 0.01, ***p < 0.001, ****p < 0.0001. Abbreviations: DOX, doxorubicin; i.p., intraperitoneal; i.g., intragastric; PrA, protosappanin A.
