
Figure 3.
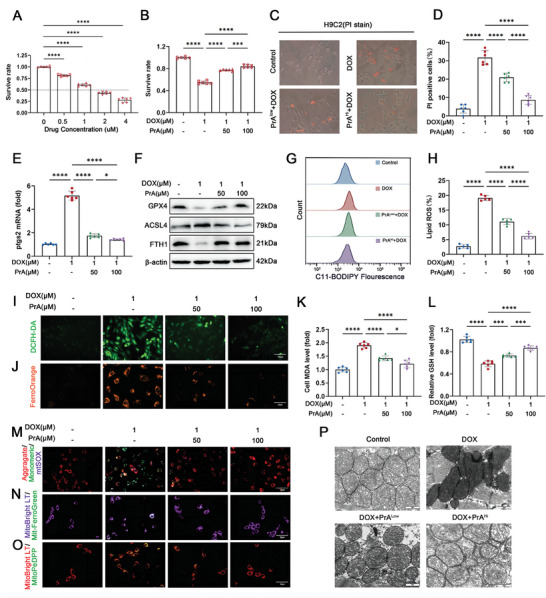
PrA protects H9c2 cells against DOX‐triggered iron accumulation, ROS production, lipid peroxidation and alleviates mitochondrial dysfunction. A) The effect in different concentrations of DOX‐induced cell death for 24 h, cell viability was detected by CCK8 assay (n = 6 per group). B) The protective effect of PrA treatment on DOX‐induced cell death in cultured H9c2 cells under control conditions, in the presence of DOX (1 × 10⁻⁶ m, 24 h) or PrA (50 × 10−6 m or 100 × 10−6 m, 30 h), cell viability was detected by CCK8 assay (n = 6 per group). H9c2 cells were pretreated with PrA in different concentrations for 6 h and then stimulated with 1 × 10⁻⁶ m DOX for 24 h. DMSO was used as vehicle control. Whole cells were used for the following assay. C) Representative images of PI staining and D) the percentage of PI‐positive cells (black and white: phase contract; red: PI staining, scale bar = 100 µm, n = 6 per group). E) Relative mRNA levels of Ptgs2 (n = 6 per group). F) Protein expression of GPX4, ACSL4, and FTH1 was measured by immunoblotting (n = 6 per group). G,H) Lipid ROS generation and quantitative analysis were captured by C11‐BODIPY staining coupled with flow cytometry (n = 5 per group). I) Representative DCFH‐DA staining image (green, scale bar = 100 µm). J) Representative fluorescent images of cytoplasmic Fe2+ stained with FerroOrange (orange, scale bar = 20 µm). Quantitative analysis of K) MDA level and L) GSH level (n = 6 per group). M) JC‐1 staining assessed membrane potential and mtSOX Deep Red staining detected mitochondrial superoxide level (red, aggregates; green, monomersscale; purple, mtSOX Deep Red; scale bar = 20 µm). N) Representative fluorescent images of mitochondrial iron using Mito‐FerroGreen (MFG) in H9c2 cells. MitoBright LT Deep Red stains the mitochondria (green, MFG; purple, MitoBright LT Deep Red; scale bars: 20 µm). O) Representative fluorescent images of mitochondrial LPs using MitoPeDPP in H9c2 cells. MitoBright LT Deep Red stains the mitochondria (green, MitoPeDPP; red, MitoBright LT Deep Red; scale bar = 20 µm). P) Electron microscopy of mitochondria in mice hearts (scale bar = 2 µm). A,B,E,K,L) Some of the data was normalized. Summary data are presented as the mean ± SEM. Statistical significance was determined using A) multiple unpaired 2‐tailed Student t‐tests and B,D,E,H,K–L) one‐way ANOVA with Tukey's multiple comparisons tests. *p < 0.05, **p < 0.01, ***p < 0.001, ****p < 0.0001. Abbreviations: DMSO, dimethylsulfoxide; DOX, doxorubicin; PrA, protosappanin A; ROS, reactive oxygen species.