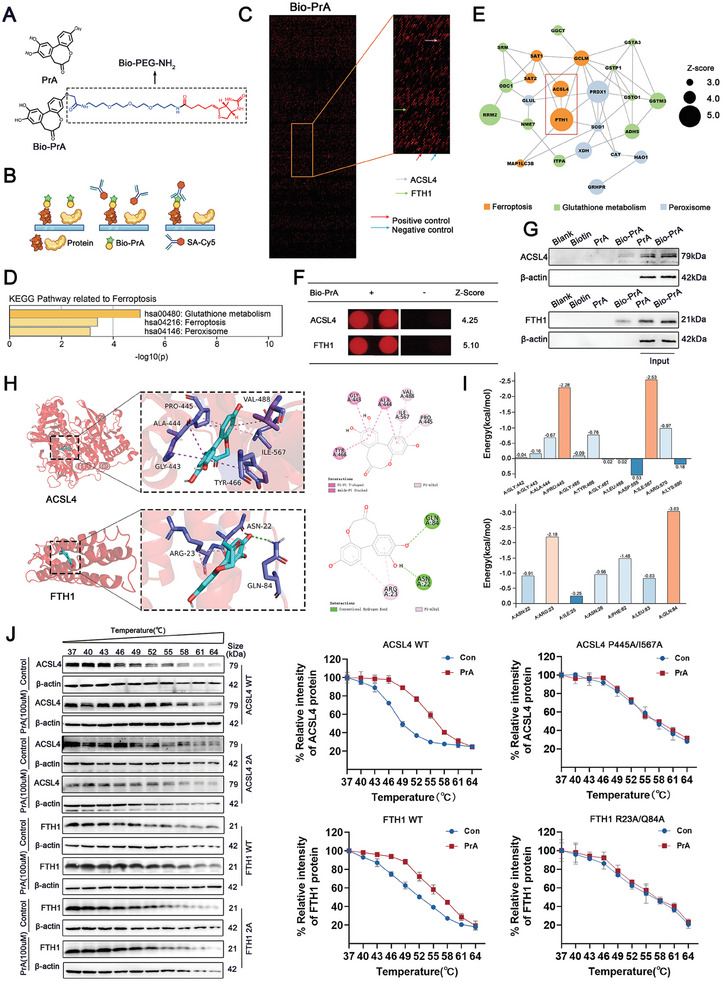
Figure 4.

Identification of PrA‐binding proteins on human proteome microarrays. A) Chemical structure of PrA and Bio‐PrA. B) Schematic of the procedure for identifying PrA‐binding proteins using microarrays fabricated with recombinant human proteins. C) Representative image of protein array showing positive (red arrow) and negative control (blue arrow) spots, as well as spots for ACSL4 (purple arrow) and FTH1 (green arrow). D) KEGG pathway of PrA‐binding proteins related to ferroptosis. E) Protein–protein interaction (PPI) network of PrA‐binding proteins related to ferroptosis (circle size represents Z‐score value, orange: the pathway of ferroptosis, green: the pathway of glutathione metabolism, blue: the pathway of peroxisome. Z‐scores were defined as the binding affinity of the target proteins to PrA). F) Magnified image of Bio‐PrA binding to ACSL4 and FTH1 spot on the protein array. Z‐score is shown. G) Biotin alone was used as a control. Bio‐PrA was added to streptavidin‐agarose beads and incubated. Lysates prepared from H9c2 cells were added to the streptavidin‐agarose beads with Bio‐Cel, and the eluent was collected for Western Blot analysis. Total lysates were used as an input control. H) Molecular docking performed the binding pose details between PrA and ACSL4 or FTH1. The figure shows that PrA forms π–π conjugated bonds with ACSL4 Gly‐443, Ala‐444, Tyr‐466, and π–alkyl bonds with ACSL4 Pro‐445, Val‐488, Ile‐567, while PrA forms π–alkyl bonds with FTH1 Arg‐23, and conventional hydrogen bonds with FTH1 Asn‐22, Gln‐84. I) Histograms of the per‐residue energy contributions of key residues involved in Protosappanin A combining with ACSL4 (top panel) and FTH1 (bottom panel). J) Cellular thermal shift assay between PrA and ACSL4 or FTH1. HEK‐293 cells were transfected with plasmids of pcDNA3.1‐3×Flag‐h‐ACSL4 (P445A, I567A) −3×Flag‐zsgreen‐puro or pcDNA3.1‐3×Flag‐h‐FTH1/FTH1 (R23A, Q84A)−3×Flag‐zsgreen‐puro. The curve was fitted using GraphPad Prism 9.0 (n = 3 per group). Abbreviations: PrA, protosappanin A.
