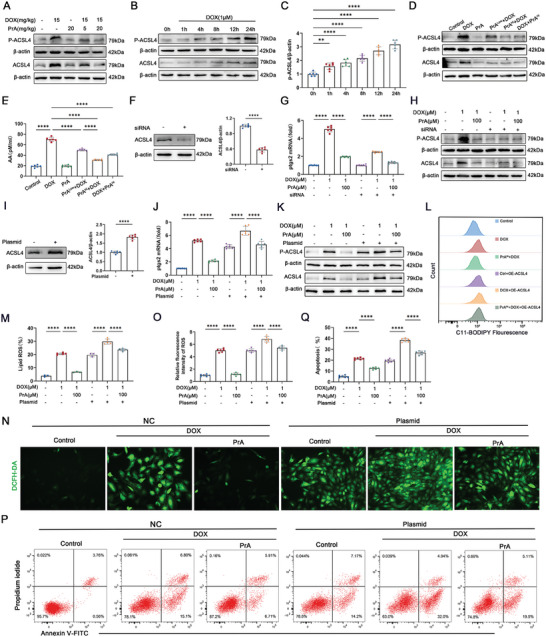
Figure 5.

PrA blocks DOX‐induced ACSL4 activation in cardiomyocytes and reduces ROS production and lipid peroxidation. A) Western blot analysis of ACSL4 and p‐ACSL4 (Thr 328) in hearts from control mice and DOX‐treated (20 mg kg−1, i.p.) mice with or without PrA (5 or 20 mg kg−1, i.g.). B,C) H9c2 cells were exposed to 1 × 10⁻⁶ m DOX for different durations. The total proteins were extracted and measured for ACSL4 and p‐ACSL4 (Thr 328) levels (n = 6 per group). D,E) H9c2 cells were pretreated with PrA in different concentrations for 6 h and then stimulated with 1 × 10⁻⁶ m DOX for 24 h, or H9c2 cells were challenged with 1 × 10⁻⁶ m DOX for 24 h and then treated with 100 × 10−6 m PrA for 6 h. DMSO was used as vehicle control. Whole‐cell lysates were used for the follow‐up experiment (n = 6 per group). D) Western blot was used to determine the levels of ACSL4 and ACSL4 Thr 328 phosphorylation. E) ELISA quantified cellular supernatant AA levels. F–H) H9c2 cells were transfected with siRNA against ACSL4 and negative control siRNA (as the control group). F) Western blot was used to detect knockdown efficiency. Quantification is shown on the right (n = 6 per group). G) Relative mRNA levels of Ptgs2 following ACSL4 knockdown (n = 6 per group). H) Western blot analysis of ACSL4 and p‐ACSL4 (Thr 328) following ACSL4 knockdown. I–Q) H9c2 cells were transfected with cDNA plasmids encoding ACSL4 or empty vector (negative control, NC). I) Western blot was used to determine ACSL4 expression. Quantification is shown on the right (n = 6 per group). J) Effect of ACSL4 overexpression on Ptgs2 levels induction by DOX (n = 6 per group). K) Western blot analysis of ACSL4 and p‐ACSL4 (Thr 328) following ACSL4 overexpression (n = 6 per group). L,M) Lipid ROS generation and quantitative analysis of ACSL4‐overexpressing H9c2 cells by C11‐BODIPY staining coupled with flow cytometry (n = 5 per group). N,O) Representative DCFH‐DA staining images and quantitative analysis of fluorescence intensity for ACSL4‐overexpressing H9c2 cells (green, scale bar: 100 µm, n = 6 per group). P,Q) Flow cytometry and quantitative analysis of Annexin V‐APC and PI in ACSL4‐overexpressing H9c2 cells (n = 6 per group). C,F,G,I,J,O) Some of the data was normalized. Summary data are presented as the mean ± SEM. Statistical significance was determined using one‐way ANOVA with D,F,I,L,N,P) Tukey's multiple comparisons tests and E,H) multiple unpaired 2‐tailed Student t‐tests. *p < 0.05, **p < 0.01, ***p < 0.001, ****p < 0.0001. Abbreviations: DOX, doxorubicin; i.p., intraperitoneal; i.g., intragastric; PrA, protosappanin A.
