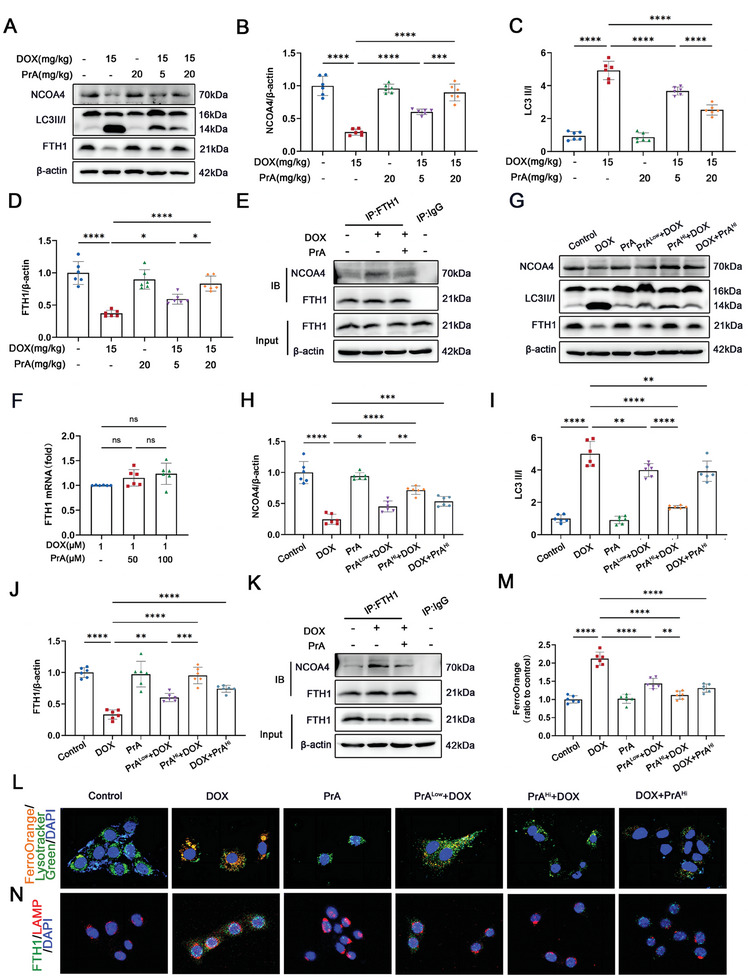
Figure 6.

PrA inhibits FTH1's autophagic degradation in lysosome. A–D) Western blot and quantitative analysis of cardiac NCOA4, LC3 II/I and FTH1 protein levels in control mice and mice treated with DOX with or without PrA (n = 6 per group). E) NCOA4‐FTH1 interactions were analyzed by coimmunoprecipitation in control mice and mice treated with DOX with or without PrA (n = 3 per group). F) Relative mRNA levels of FTH1 were measured in control H9c2 cells and cells treated with PrA in different concentrations for 6 h and then stimulated with 1 × 10⁻⁶ m DOX for 24 h (n = 6 per group). G) Western blot analysis of NCOA4, LC3 II/I and FTH1 in control H9c2 cells and cells pretreated with PrA in different concentrations for 6 h and then stimulated with 1 × 10⁻⁶ m DOX or 24 h or H9c2 cells were challenged with 1 × 10⁻⁶ m DOX for 24 h and then treated with 100 × 10−6 m PrA for 6 h. H–J) Quantitative analysis of the protein levels of H) NCOA4, I) LC3 II/I, and J) FTH1 in panel G (n = 6 per group). K) NCOA4‐FTH1 interactions were analyzed by coimmunoprecipitation in control H9c2 cells and cells treated with DOX with or without PrA (n = 3 per group). L,M) Representative confocal images and quantitative analysis of FerroOrange co‐localized with LysoTracker Green in H9c2 cells (orange: FerroOrange, green: LysoTracker Green, blue: DAPI, scale bars:20 µm, n = 6 per group). N) Representative immunofluorescence imaging of FTH1in H9c2 cells. (green: FTH1, red: LAMP, blue: DAPI, scale bars: 20 µm). B–D,F,H–J,M) Some of the data was normalized. Summary data are presented as the mean ± SEM. Statistical significance was determined using one‐way ANOVA with Tukey's multiple comparisons test. *p < 0.05, **p < 0.01, ***p < 0.001, ****p < 0.0001. Abbreviations: DOX, doxorubicin; PrA, protosappanin A; SEM, standard error of mean.
