
Figure 3.
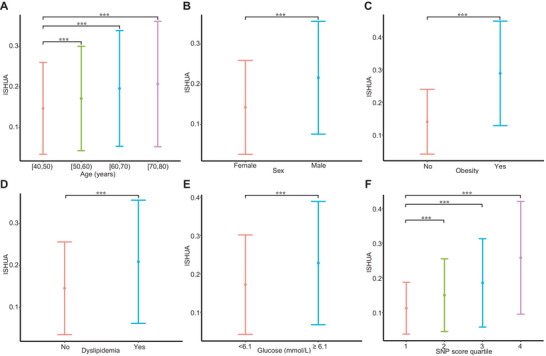
Association of known hyperuricemia risk factors with ISHUA in the train set. ISHUA was evaluated for association with known demographic, clinical and genetic risk factors for hyperuricemia. A) Age, stratified by four decades of age groups. B) Sex, categorized into male and female. C) Obesity, defined as BMI ≥ 30. D) Dyslipidemia, defined based on LDL‐C, CHO, HDL‐C, and TG levels. E) Blood glucose. F) SNP score, derived from the hyperuricemia probabilities of the stacked machine learning model using only genetic features was stratified by quartiles. Data are presented as mean ± standard deviation. Univariate linear regression was used to assess the association between variables and ISHUA: **, P < 0.001. ISHUA, insilico score for hyperuricemia; BMI, body mass index; SNP, single nucleotide polymorphisms.