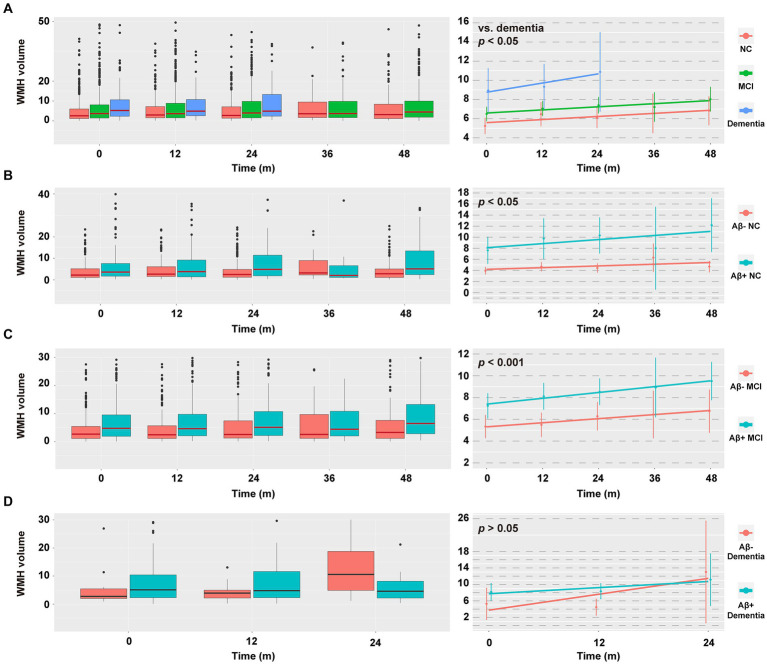
Figure 4.
Data distribution and change in WMH volume within the next 48 months. (A–D) Data distribution of WMH volume (left column) and estimated means of WMH volume (right column) in different diagnostic groups. Raw values above 50/40/30/30 cm3 were discarded in A/B/C/D (left column) for the sake of aesthetics, with n = 24/15/55/13, respectively. Due to limited numbers, the follow-up WMH values cannot be predicted in the dementia group at the 36th and 48th month. The horizontal line in the middle of each box (left column) indicates the median, the top and bottom borders of the box mark the 75th and 25th percentiles. The modeled data (right column) show the mean 95% CIs for the predicted values using a linear mixed-effects model adjusted for age, sex, educational level, APOE ε4 status, total intracranial volume, and baseline WMH volume. p values indicate the group × time interaction effect. For effect estimates and statistical significance values, see Supplementary Tables S10, S11. NC, cognitively normal control; MCI, mild cognitive impairment; WMH, white matter hyperintensity; CSF, cerebrospinal fluid; Aβ, β-amyloid; APOE, apolipoprotein E.

