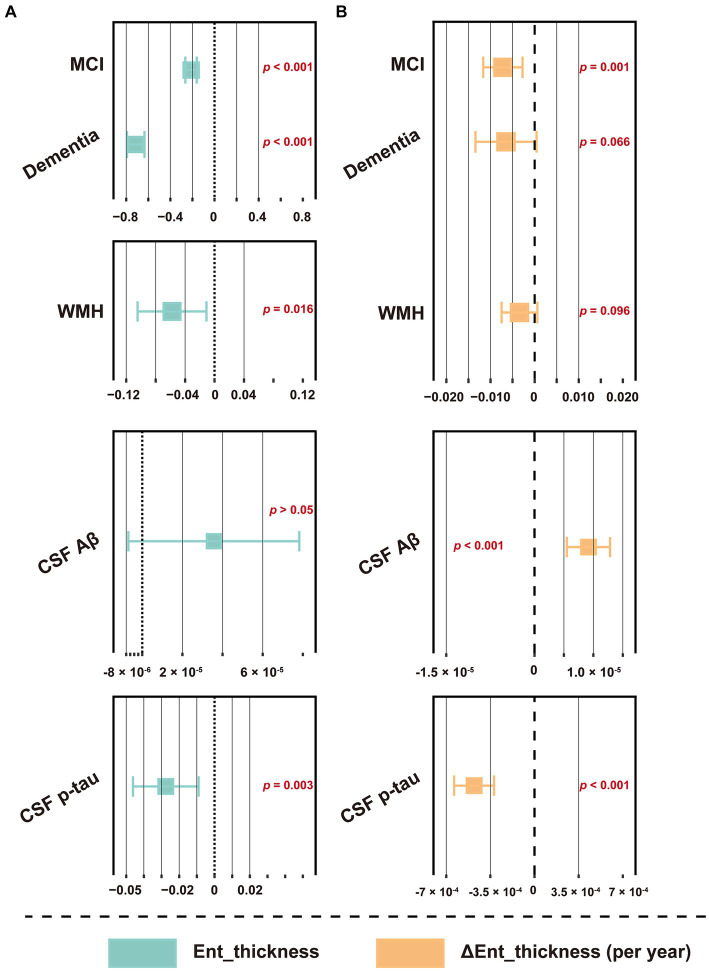
Figure 7.
Forest plot of the association between WMH volume and entorhinal cortex thickness. (A) The association between baseline WMH volume and entorhinal cortex thickness. (B) The association between baseline WMH volume and the changes slope of entorhinal cortex thickness. Baseline WMH volume, plus diagnostic status, age, sex, education, APOE ε4 status, hypertension and smoking status, and CSF core biomarkers, including Aβ42 and p-tau levels were used as predictors of cognitive function slopes. The WMH volume was total intracranial volume-normalized and log-transformed. CSF t-tau was not included due to its extremely high correlation with p-tau (R > 0.900, p < 0.001). For effect estimates with exact 95% CI and statistical significance values, see Supplementary Table S13. MCI, mild cognitive impairment; WMH, white matter hyperintensity; CSF, cerebrospinal fluid; Aβ, β-amyloid; p-tau, phosphorylated tau; t-tau, total tau; APOE, apolipoprotein E; MEM, memory sub-domain; EF, executive function; ADNI, Alzheimer’s Disease Neuroimaging Initiative; CI, confidence interval.

