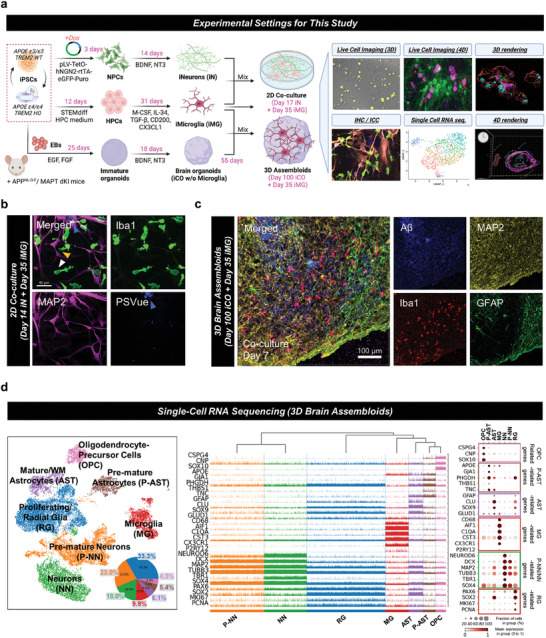
Figure 1.

Experimental models (2D/3D/4D co‐culture) used in this study. a) Development of 2D/3D/4D co‐culture systems. The iPSC‐derived neurons (DIV 14) and microglia (DIV 35) were co‐cultured for immunocytochemistry, live cell imaging, and IMARIS 3D/4D rendering. Additionally, brain assembloids (DIV 100 brain organoids including DIV 35 iPSC‐derived microglia) were used for single‐cell RNA sequencing, immunohistochemistry, and IMARIS 3D rendering. b) Confocal microscopy imaging was used for the validation of 2D co‐culture systems. Human iPSC‐derived microglia (anti‐Iba1) mingle with iPSC‐derived neurons (anti‐MAP2), and externalized PtdSer (PSVue) are observed around the neurons. Green, microglia, anti‐Iba1; Pink, neurons, MAP2; Blue and white arrows, ePtdSer+, PSVue. Scale bar = 40 µm. c) Infiltration of microglia into the brain organoid. Blue, amyloid‐beta, anti‐D54D2; green, astrocytes, anti‐GFAP; red, microglia, anti‐Iba1; yellow, neurons, anti‐MAP2; white arrows, the deepest reaches of microglia. Scale bar = 100 µm. d) Characterization of brain assembloids via single‐cell RNA sequencing analysis. Uniform Manifold Approximation and Projection (UMAP) displaying the assembloids (n = 17,472 cells). A microglial population (a circle with a dotted line) was detected in the brain assembloids. Tracksplot showed gene expression levels by height. Dot plot showing the expression levels and fractions of cells expressing each cell type marker genes.
