
Figure 3.
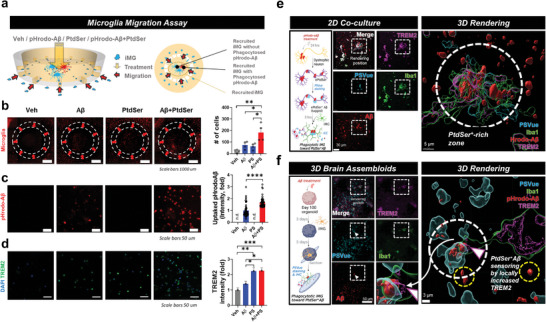
Microglia gravitate toward ePtdSer+ Aβs via TREM2. a) Schematic illustration of microglia migration chip. Four independent treatment conditions (‘No treatment’ vs ‘pHrodo‐oAβ’ vs ‘PtdSer’ vs ‘pHrodo‐oAβ + PtdSer’) were compared. b) Microglia gravitate toward ePtdSer+ Aβs. The number of cells was counted. c) Comparison of pHrodo‐oAβ intensity (uptaked pHrodo‐oAβ) between the ‘pHrodo‐oAβ’ and ‘pHrodo‐oAβ + PtdSer’ condition. d) Comparison of TREM2 intensity. e) Microglia gravitate toward Aβs in the PtdSer+ rich zone (2D co‐culture). 3D rendering image shows engulfment of ePtdSer+ Aβs by microglia via TREM2. Scale bar = 30 µm or 5 µm. f) Microglia gravitate toward ePtdSer+ Aβs (white circle) rather than Aβs alone (yellow circle) via TREM2 in the brain assembloid. 3D rendering image shows the captured moment of the microglial arm with high expression of TREM2 toward ePtdSer+ Aβs. For (a‐d), *p < 0.05, **p < 0.01, ****p < 0.0001, multiple comparisons (ANOVA) with Tukey's post‐hoc test or unpaired t‐test were used for statistical analyses. Microglia, pseudo‐colored; pHrodo‐oAβ, red; DAPI, blue; TREM2 green. For (e,f), Scale bar = 50 µm or 3 µm. White box, 3D rendering position; white circles for (e), PtdSer+ rich zone; white circle for (f), ePtdSer+ Aβ sensing via TREM2; yellow circle for (f), Aβ alone; pink arrow, the TREM2‐expressing microglial arm for sensing ePtdSer+ Aβ; blue, PSVue; green, anti‐Iba1; red, MX04; pink, anti‐TREM2.