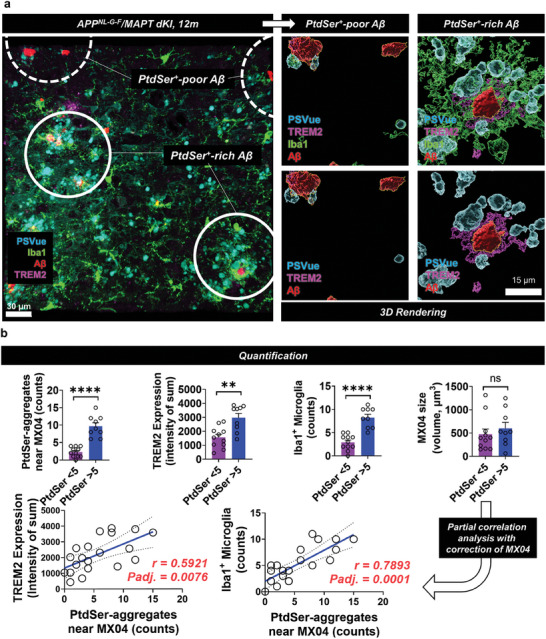
Figure 4.

Difference in microglial responses toward Aβ plaques between PtdSer+ rich and poor zones in APPNL‐G‐F /MAPT dKI mice (12 months). a) The active microglia (high expression of TREM2) and the number of microglia (Iba1+) were significantly increased in the PtdSer+ rich zone. b) Quantification and correlation data. *p < 0.05, ***p < 0.001, independent t‐test; adjusted p‐values, p‐values from partial correlation analysis with the correction of MX04 (Aβ plaques) size; white circles for (a), PtdSer+ rich zone or PtdSer+ poor zone; blue, PSVue; green, anti‐Iba1; red, MX04; pink, anti‐TREM2. In N = 4 slices, MX04 regions (n = 12 for PtdSer aggregates < 5 and n = 8 for PtdSer aggregates> 5; total n = 20 spots; PtdSer aggregates were counted by IMARIS software after 3D rendering) were selected and quantified.
