
Figure 6.
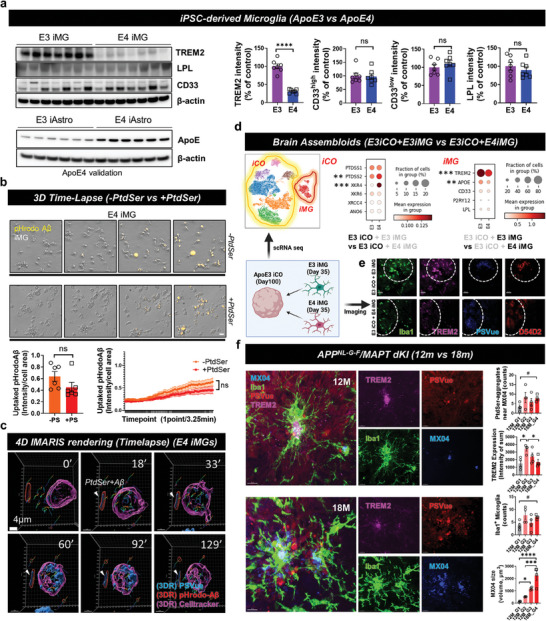
Loss‐of‐function of TREM2 toward ePtdSer+‐Aβ in both sporadic and familial AD model. a) Comparison of microglial markers between ApoE ɛ4/ɛ4 and ɛ3/ɛ3 iMG (upper band set) and validation of ApoE genotypes with iPSC‐derived astrocytes (iAsts; lower band set). Due to the low expression levels of ApoE proteins in iMG, we used iAsts for APOE genotype validation. **** p < 0.0001, independent t‐test. b) The 3D long‐term live‐cell imaging shows that PtdSer treatment does not affect the phagocytic activity of ApoE ɛ4/ɛ4 iMG. N = 6 slides for each group; average n = 30.38 cells were tracked per one field of view (scale bar = 20 µm). P‐values by independent t‐test and comparison of area under curves. c) 4D time‐lapse imaging with 3D rendering using IMARIS software. ApoE ɛ4/ɛ4 iMG show deficient phagocytic activity on ePtdSer+ Aβ. blue, PSVue; red, pHrodo‐Aβs; pink, cell‐tracker 647, microglia. Scale bar = 4 µm. d) Comparison of ApoE ɛ4/ɛ4 and ɛ3/ɛ3 iMGs with single cell RNA sequencing using human brain assembloids. Dot plots show the expression levels and fraction of cells that express each gene in iCOs and iMG. Statistical significance of differentially expressed genes and P‐values were calculated using Wilcoxon rank sum test for each group. e) Comparison of ePtdSer+ Aβs and microglial TREM2 in brain assembloids between ApoE ɛ4/ɛ4 and ɛ3/ɛ3 brain assembloids. blue, PSVue; green, anti‐Iba1; red, Aβ, anti‐D54D2; pink, anti‐TREM2. Scale bar = 50 µm. f) Comparison of ePtdSer+ Aβs and microglial TREM2 in the brain cortical sections of APP/MAPT dKI mice between 12‐month‐old mice and 18‐month‐old mice. 12 month‐group 1 (12M_G1), MX04 volume < 500; 12 month‐group 2 (12M_G2), 500 < MX04 volume < 1000; 12 month‐group 3 (12M_G3), MX04 volume > 1000; 18 month‐group 4 (18M_G4), MX volume > 1000. Sequential groups represent the progression of AD (from acute to chronic status). N = 4 slices were used for each bar. blue, PSVue; red, anti‐Iba1; blue, Aβ (MX04); pink, anti‐TREM2. Scale bar = 10 µm. #p = 0.05, independent t‐test; *p < 0.05, ***p < 0.001, and ****p < 0.0001 by ANOVA with post‐hoc test; ns, no significance.