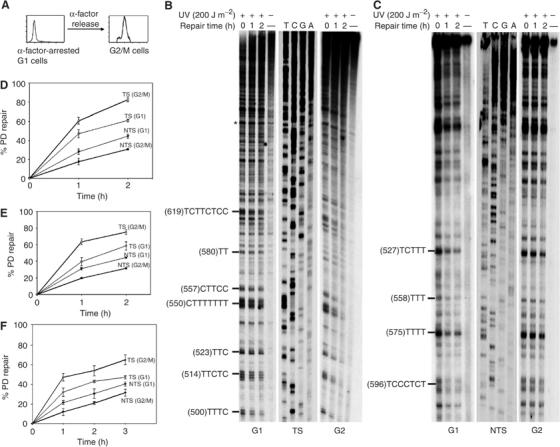
Figure 1.

Strand bias for NER is more pronounced in G2/M phase of haploid cells. S. cerevisiae cells synchronized in G1 or G2/M were UV-irradiated and allowed to repair for the indicated periods of time, and then NER was analyzed by primer extension. (A) FACScan analysis showing the synchronization procedure. (B, C) Autoradiograms showing repair of the PDs formed along the GAL10 TS and NTS, respectively. Asterisks, nonspecific Taq polymerase arrests; sequencing reactions (T, C, G, A). The pyrimidine tracks on the left represent the main PD clusters, with the accompanying number in parentheses referring to the 5′ nucleotide of the cluster. (D–F) Quantitative analysis of PD removal from the GAL10 and ACT1 genes, respectively. Illustrated are the fractions (%) of PD removed at each repair time. Each data point corresponds to an average value for the repair of several PD clusters. Inter-lane loading differences were corrected as described in Materials and methods. Each error bar represents the standard deviation of at least three experiments.
