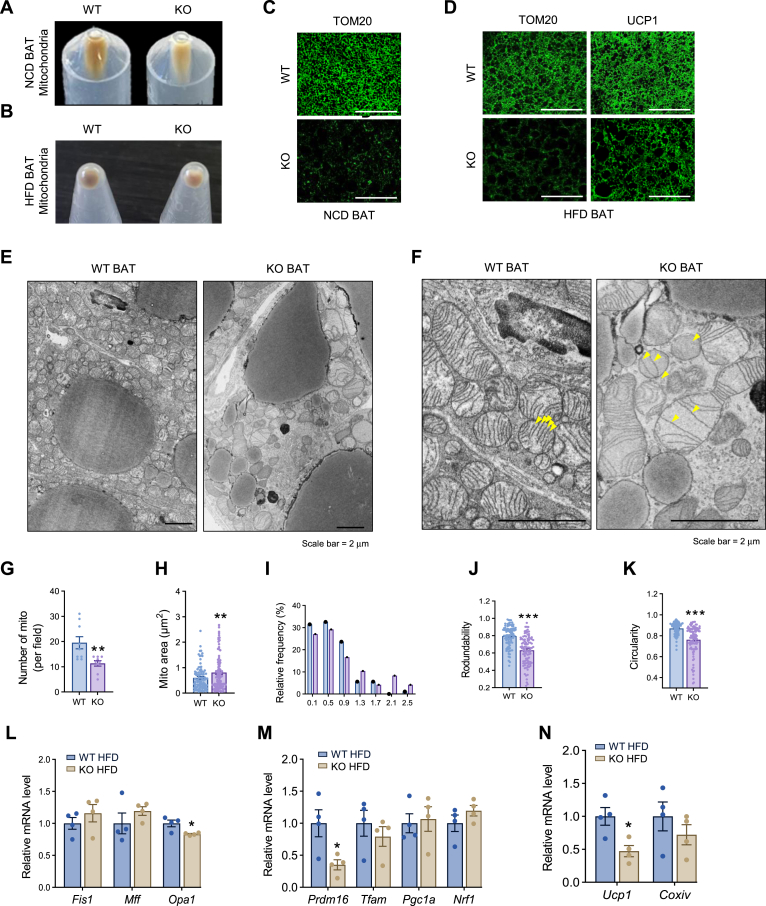
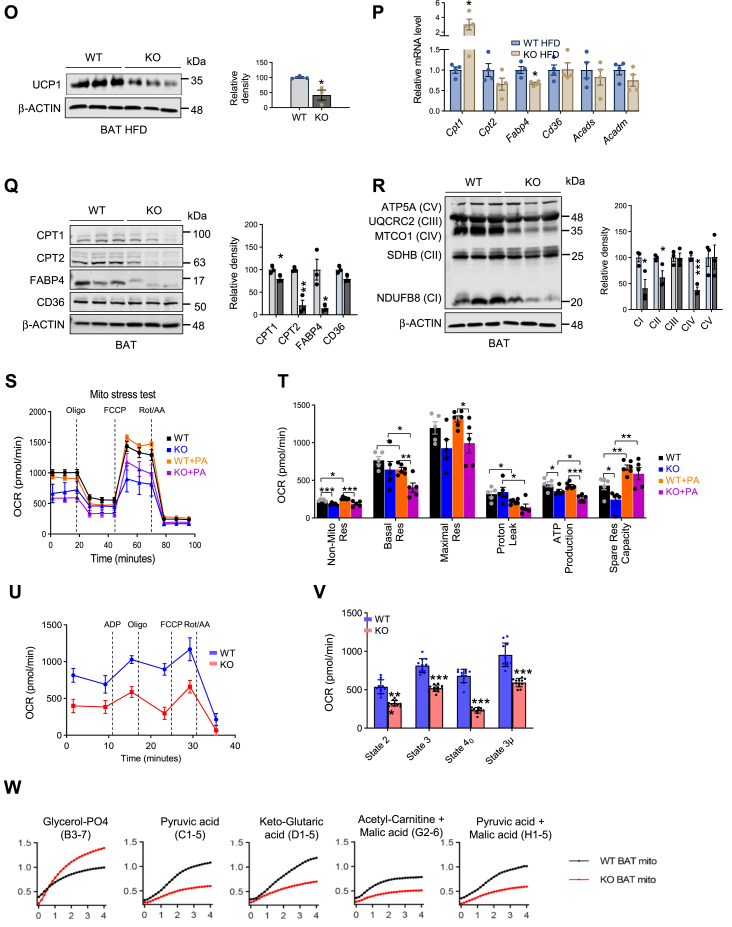
Fig. 4.
DRP1 knockout in adipose tissue causes unique morphological and pathological changes in BAT. (A) Images of isolated mitochondrial pellets from one entire BAT of WT and KO fed on NCD (representative of 6 mice/group). (B) Images of isolated mitochondrial pellets from one entire BAT of WT and KO fed on HFD (representative of 5 mice/group). (C) IF staining of TOM20 in the BAT of NCD-fed WT and KO mice. Scale bar = 100 μm. (D) IF staining of TOM20 and UCP1 in the BAT of WT and KO mice after HFD feeding. Scale bar = 100 μm. (E) Transmission electron microscope (TEM) images of BAT in the WT and KO mice. (F) High magnification for TEM images of BAT in the WT and KO mice. Scale bar in (E, F) = 2 μm. (G–K) Morphometric quantification of mitochondria for the TEM analysis in (E). (L) qPCR analysis of the mitochondrial dynamic–related genes in the BAT of HFD-fed WT and KO mice (n = 4/group). (M, N) qPCR analysis of the mitochondrial function and biogenesis-related genes in the BAT of HFD-fed WT and KO mice (n = 4/group). (O) Representative Western blots and densitometric analysis of UCP1 in the BAT of HFD-fed WT and KO mice (n = 3/group). (P) qPCR analysis of the fatty acid metabolism–related genes in the BAT of HFD-fed WT and KO mice (n = 4/group). (Q) Representative Western blots and densitometric analysis of CPT1, CPT2, and UCP1 in the BAT of HFD-fed WT and KO mice (n = 3/group). (R) Representative western blots and densitometric analysis of oxidative phosphorylation (OXPHOS) protein complexes in the BAT of HFD-fed WT and KO mice (n = 3/group). ∗P < 0.05, ∗∗P < 0.01, and ∗∗∗P < 0.001, unpaired Student’s t test. (S) Oxygen consumption rate (OCR) for Mitochondrial Stress Test (MST) of the differentiated adipocytes of WT and KO mice. BSA-conjugated palmitic acid (PA, 100 μM) was added to the assay medium 2 h before the MST (n = 5). (T) Parameters for mitochondrial respiratory based on data for the OCR in (T). ∗P < 0.05, ∗∗P < 0.01, ∗∗∗P < 0.001, one-way ANOVA followed by Turkey’s post hoc test. (U, V) OCR for electronic coupling assay of the isolated mitochondria from the BAT of WT and KO mice fed on NCD (n = 11/group). ∗∗∗P < 0.001, unpaired Student’s t test for (W). (W) Kinetics of electron transport of isolated mitochondria in the presence of several mitochondrial substrates. Mitochondria were isolated from the BAT of WT and KO fed on NCD. BAT, brown adipose tissue; DRP1, dynamin-related protein 1; HFD, high-fat diet; IF, immunofluorescent; NCD, normal chow diet; qPCR, quantitative-PCR; UCP1,uncoupling protein 1.


