. 2024 Sep 26;14(42):30807–30829. doi: 10.1039/d4ra04512b

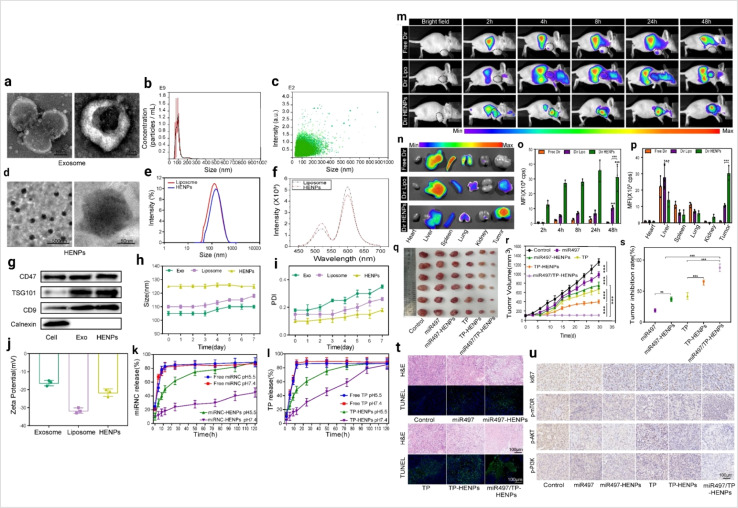
Fig. 15. Liposome hybrid in cancer therapy (a) representative image of exosomes captured by TEM at different magnifications. (b) The size distribution of exosomes and (c) the particle size distribution range of exosomes as measured by NTA. (d) The morphology of HENPs detected by TEM. (e) Size distribution of liposomes and HENPs. (f) The FRET assay showed the successful fusion of exosomes and liposomes. (g) Protein expression of exosomes and HENPs nanovesicles. (h and i) The nanoparticle size and PDI over time, used to assess the stability of the nanoparticles. (j) Zeta potential distribution of exosomes, liposomes and HENPs. (k and l) Release profiles of miRNC and TP at pH values of 5.5 and 7.4 at 37 °C. The targeting and antitumor activity of miR497/TP-HENPs in vivo. (m) In vivo imaging to observe the tumor targeting ability of different nanoparticles. (n) Ex vivo fluorescence images of the main organs and tumors isolated from mice bearing subcutaneous SKOV3-CDDP tumors. (o) Quantitative analysis of Dir distribution in the tumor site postinjection elevated by the fluorescence intensity measured in (m). (p) Quantitative assessment of the mean fluorescence intensity in major organs and isolated subcutaneous tumors. (q) Representative photographs of subcutaneous tumors harvested from all treatment groups. (r) Growth record curves of subcutaneous tumors in nude mice during the experiment. (s) The inhibition rate of OC treated with various drugs. (t) The H&E staining and TUNEL staining. (u) Immunohistochemical detection of ki67, p-PI3K, p-AKT, and p-mTOR (reproduced with permission under Creative Commons CC BY 4.0 license from ref. 156 Copyright @ 2022The Authors).

Fig. 15