
Figure 1.
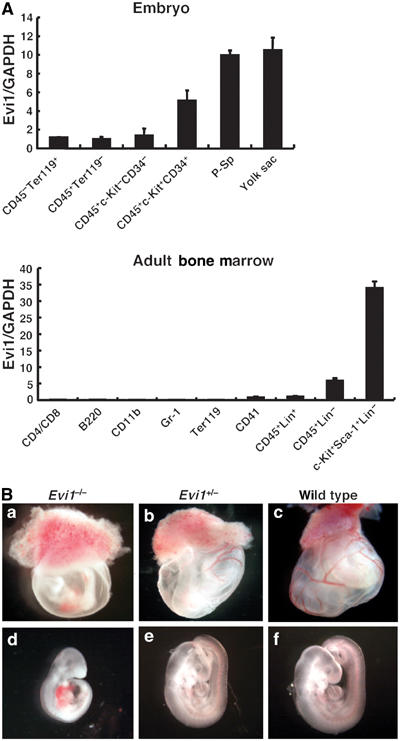
Expression pattern of Evi1 in hematopoietic cells and gross appearance of E9.5 Evi1−/− embryos. (A) Quantitative RT–PCR analysis of Evi1 mRNA in hematopoietic cells from mouse embryos and adult bone marrow. The embryonic cells analyzed are CD45−Ter119+ primitive erythrocytes, CD45+Ter119− hematopoietic cells other than primitive erythrocytes, CD45+c-Kit−CD34− mature hematopoietic cells, a CD45+c-Kit+CD34+ HSC-enriched population and para-aortic splanchnopleura (P-Sp). The bone marrow cells analyzed are CD4+/CD8+, T cells; B220+, B cells; CD11b+, macrophages and monocytes; Gr-1+, granulocytes; Ter119+, erythrocytes; CD41+, megakaryocytes; CD45+Lin+, mature hematopoietic cells; CD45+Lin−, immature hematopoietic cells; c-Kit+Sca-1+Lin−, HSC-enriched population. A mixture of anti-Mac-1, -Gr-1, -B220, -CD4, -CD8 and -Ly-6 antibodies was used as a lineage marker (Lin). Evi1 mRNA was assayed by real-time PCR (Materials and methods). The data were normalized to GAPDH mRNA and calibrated to the Evi1/GAPDH ratio (ΔCT) in CD45−Ter119+ cells in mouse embryos and CD45+Lin+ in adult bone marrow. The data are the mean and standard deviation of 2−ΔΔCt in triplicate assays. (B) (a) The yolk sac from Evi1−/− embryos shows severe anemia and defective large vessel development, while large vessels developed and were organized in the yolk sac of Evi1+/− (b) and wild-type embryos at E9.5 (c). (d–f) Gross appearance of Evi1−/− (d), Evi1+/−(e) and wild-type (d) embryos at E9.5. The Evi1−/− embryo is smaller and much paler than the wild-type littermate, while also showing pericardial effusion and hemorrhaging.