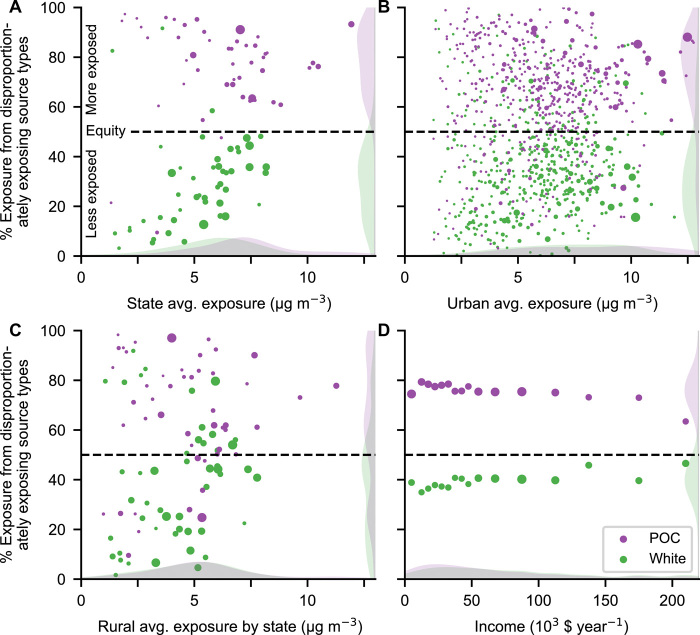
Fig. 2. Percent of PM2.5 exposure caused by emission source types that disproportionately expose people of color (POC) and Whites.
Data shown for (A) U.S. states (n = 48 states), (B) urbanized areas (n = 481 areas), (C) rural areas in each state (n = 48 states), and (D) income bins (n = 16 bins; last bin is >$200,000). Icon area is proportional to population; shaded areas are kernel density estimates. A y axis value of 50% would represent equity for that group (i.e., for the population-average exposure), meaning that half of their exposure comes from source types that disproportionately expose them and the other half is from source types that expose them less than average. Across geographies and levels of exposure (A to C), as well as incomes (D), most emission sources consistently result in higher exposures for POC and lower exposures for Whites. Source: data file S2.

