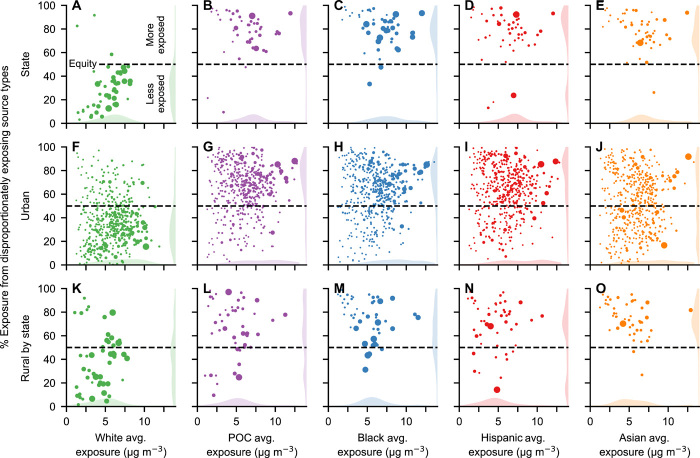
Fig. 3. Percent of PM2.5 exposure caused by emission source types that disproportionately expose each racial-ethnic group by location and race-ethnicity.
Icon area is proportional to population; shaded areas are kernel density estimates. This figure is analogous to Fig. 2 but with results for all five racial-ethnic groups. Source: data file S2.

