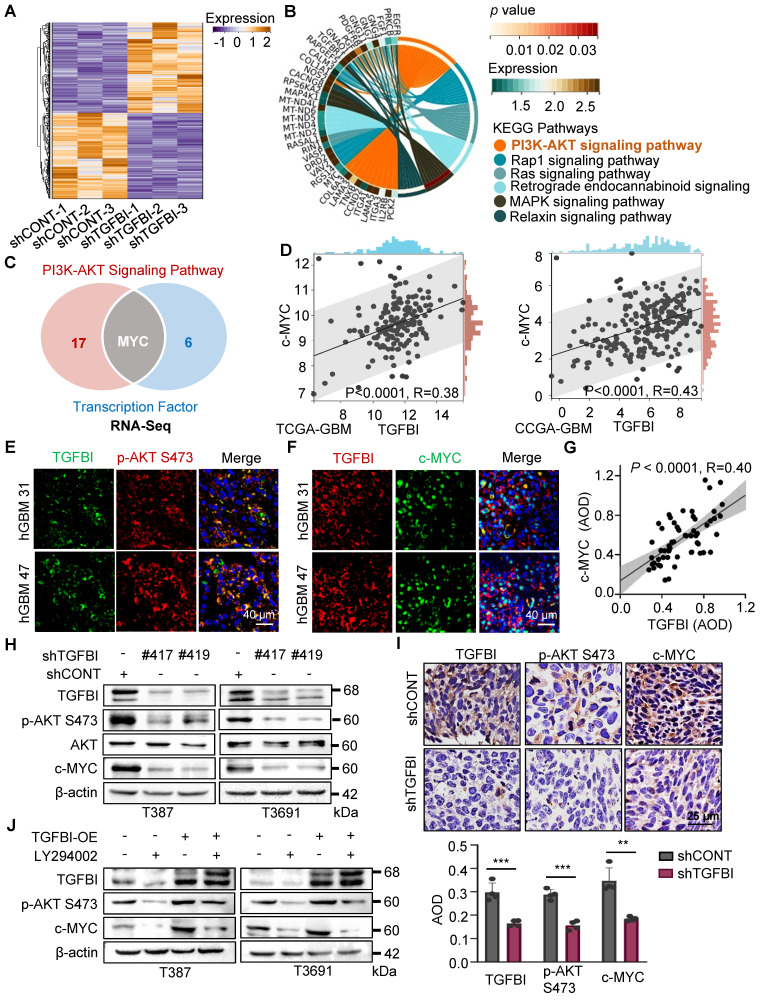
Figure 4.
TGFBI sustains GSCs through AKT-c-MYC pathway. (A) Heatmap illustrating the transcriptional profile of T3691 GSCs transduced with shCONT or shTGFBI. (B) KEGG pathway analysis of downregulated differentially expressed genes in shTGFBI T3691 GSCs (compared to the shCONT group). (C) Venn diagram depicting the differentially expressed genes highly active in the PI3K-AKT signaling pathway and serving as transcription factors. (D) Scatter plot displaying the correlation between TGFBI and c-MYC mRNA expression in the TCGA-GBM and CGGA-GBM datasets. (E) IF image of TGFBI and p-AKT S473 and (F) c-MYC in human GBM specimens. Scale bars: 40 μm. (G) IHC stain demonstrating the association between TGFBI and c-MYC proteins in human gliomas. n = 58 (H) IB of p-AKT S473 and c-MYC proteins in the GSCs transduced with shCONT or shTGFBI under hypoxia. (I) IHC stain of TGFBI, p-AKT S473, and c-MYC proteins in the mouse xenografts. Also shown is the quantification of the average density of mouse xenografts (bottom, n = 4). (J) IB of p-AKT S473 and c-MYC proteins in the indicated cells. LY294002, an AKT pathway inhibitor.

