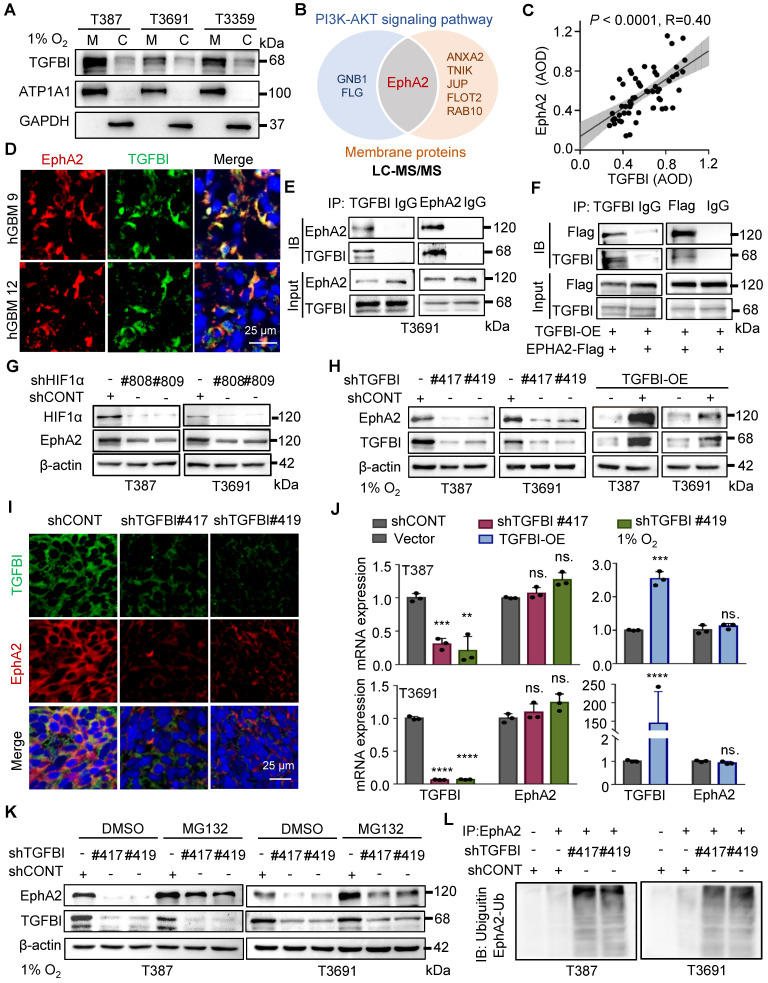
Figure 5.
TGFBI binds to EphA2 and stabilizes it by inhibiting its proteasomal degradation. (A) Analysis of membrane and cytosol protein extraction in GSCs under hypoxia. M, membrane; C, cytosol (B) Venn diagram displaying TGFBI-binding proteins of T3691GSCs under hypoxia highly expressed in the PI3K-AKT signaling pathway and located in membrane according to LC-MS/MS. (C) IHC staining demonstrating the correlation between TGFBI and EphA2 proteins in human gliomas. n = 58 (D) IF image of TGFBI and EphA2 in human GBM specimens. Scale bars: 25 μm. (E) Co-IP of endogenous TGFBI and EphA2 in T3691 GSCs under hypoxia. IgG served as a control. (F) Co-IP of exogenous TGFBI and EphA2 in 293T. (G) IB of EphA2 protein in the GSCs transduced with shCONT or shHIF1α under hypoxia. (H) IB of EphA2 protein in the GSCs with TGFBI knockdown or overexpression. (I) IF image of TGFBI and EphA2 in the indicated mouse xenografts. The quantification of the relative intensity of fluorescence is shown in Figure S4F (n = 8). Scale bars: 25 μm. (J) qRT-PCR analysis of TGFBI and EphA2 mRNA expression in the indicated GSCs. (K) IB of EphA2 proteins in the indicated cells. MG132, a proteasome inhibitor. (L) Co-IP of ubiquitin-EphA2 in the indicated GSCs. The input is shown in Figure S4H. Data are presented as the mean ± SD. ns., no significance; **P < 0.01; ***P < 0.001; ****P < 0.0001.

