. 2024 Aug 30;17(9):sfae272. doi: 10.1093/ckj/sfae272

Figure 5:

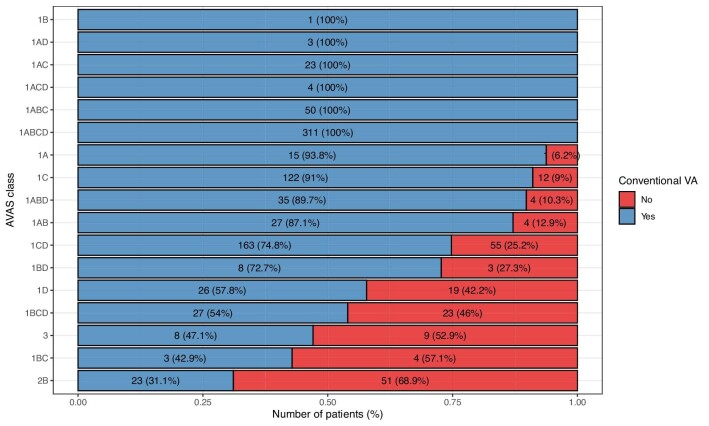
The accuracy of individual AVAS classes and created VA types expressed in weighted percentage of agreement. The X-axis displays proportion of created VA. The Y-axis portrays AVAS classes. Blue bars represent the number of VA that were conventional for the individual AVAS class. Red bars signify the number of VA that were evaluated as unconventional for each AVAS class. The total number of patients and percentage of each AVAS class are displayed within the bars.

The accuracy of individual AVAS classes and created VA types expressed in weighted percentage of agreement. The X-axis displays proportion of created VA. The Y-axis portrays AVAS classes. Blue bars represent the number of VA that were conventional for the individual AVAS class. Red bars signify the number of VA that were evaluated as unconventional for each AVAS class. The total number of patients and percentage of each AVAS class are displayed within the bars.