. 2024 Aug 30;17(9):sfae272. doi: 10.1093/ckj/sfae272

Figure 6:

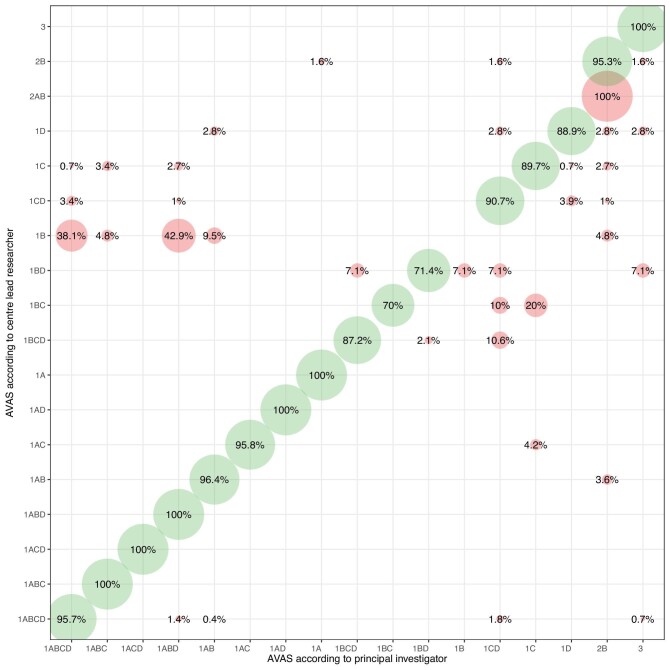
The accuracy of assessing individual AVAS classes by investigators expressed as weighted percentage of agreement. The X-axis represents the evaluation by principal investigator (K.Lawrie), while the Y-axis presents the evaluation by vascular access specialist at the centre. Green demonstrates the agreement between investigators, while red displays AVAS classes, where the evaluation of AVAS between investigators and the principal investigator differed.

The accuracy of assessing individual AVAS classes by investigators expressed as weighted percentage of agreement. The X-axis represents the evaluation by principal investigator (K. Lawrie), while the Y-axis presents the evaluation by vascular access specialist at the centre. Green demonstrates the agreement between investigators, while red displays AVAS classes, where the evaluation of AVAS between investigators and the principal investigator differed.