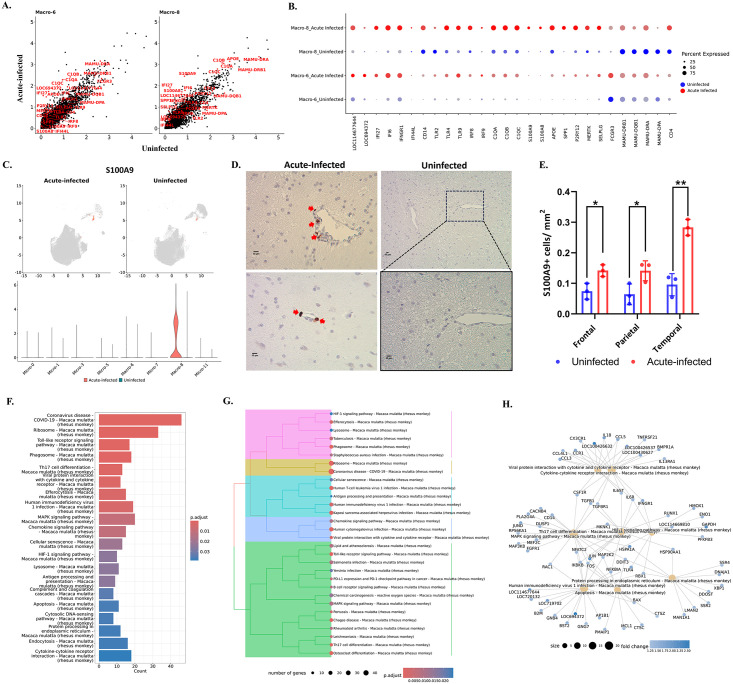
Fig 5. Altered gene expressions and pathways in macrophage during acute SIV infection.
(A) The comparison of the gene expression levels between the acute-infected animals and uninfected animals for macrophage clusters. Some of the significantly changed genes were labeled in red. (B) Selected DEGs in uninfected animals (blue dots) and animals with acute infection (red dots) for each macrophage cluster. (C) The expression of S100A9 in brain myeloid cell clusters. The acute-infected and uninfected conditions were plotted separately. (D) Representative images (scale bars, 10 μm) of S100A9 staining in the parietal (upper) or temporal (lower) lobes from frontal of acute-infected animals (left) and temporal lobe of an uninfected animal (right). The red arrow indicates the S100A9+ cells (cells in the Macro-8 cluster) found in the perivascular space of the acute-infected animals. (E) Quantification of S100A9+ cells per mm2 in different brain regions. Adjusted p value: * < 0.05, ** < 0.01. (F) Top 20 upregulated pathways in macrophages from acute infection animals. Overall upregulated genes with adjusted p values of less than 0.05 in macrophages were used for the Kyoto Encyclopedia of Genes and Genomes (KEGG) pathways analyses. (G) The hierarchical clustering of upregulated KEGG pathways of macrophage in acute infection. (H) The gene-pathway networks between the specific pathways and human immunodeficiency virus 1 pathway. LOC114677644 and LOC694372 are the MHC class I molecules.

