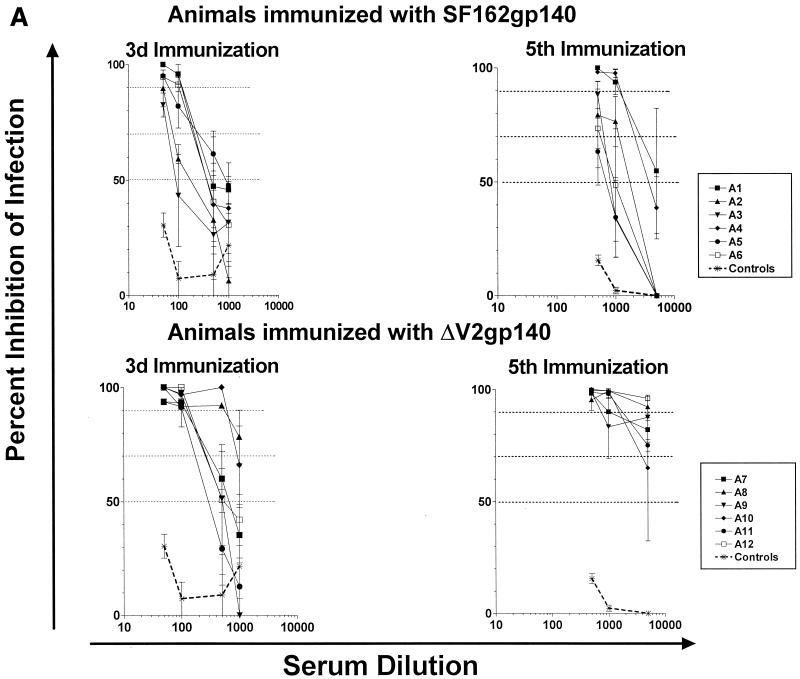
FIG. 2.
Results of neutralization experiments using rabbit sera collected following the third and fifth immunizations against the SF162ΔV2 (A) and SF162 (B) viruses. Data are representative of at least three independent experiments. Symbols indicate the mean percent neutralization and standard deviation from triplicate wells. Dashed lines indicate 50, 70, and 90% inhibition of infection. Asterisks (controls) represent neutralization curves obtained with sera collected from animals that were immunized with the DNA vector alone and are indicative of nonspecific neutralization.


