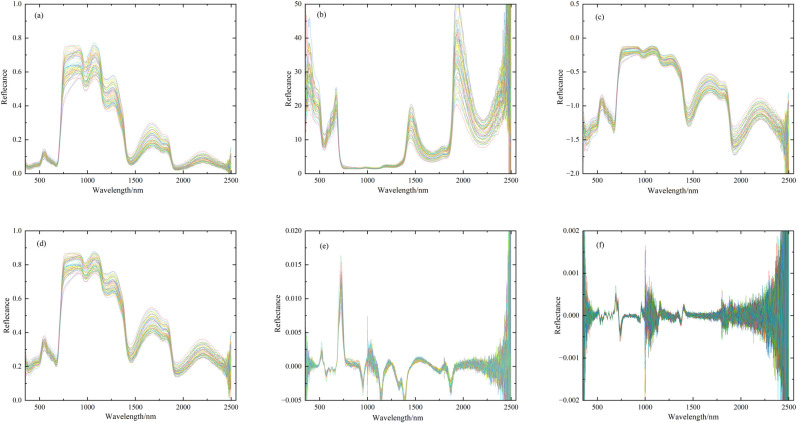
Fig 1. The curves of the original spectra and five types of transformation spectra.
Each color line represents a sample reflectance curve, with a total of 52 samples. (a) represents the original spectra (R); (b), (c), (d), (e) and (f) represent the reciprocal (1/R), logarithmic (logR), square root (R1/2), first-derivative (R’) and second-derivative spectra (R′′), respectively.

