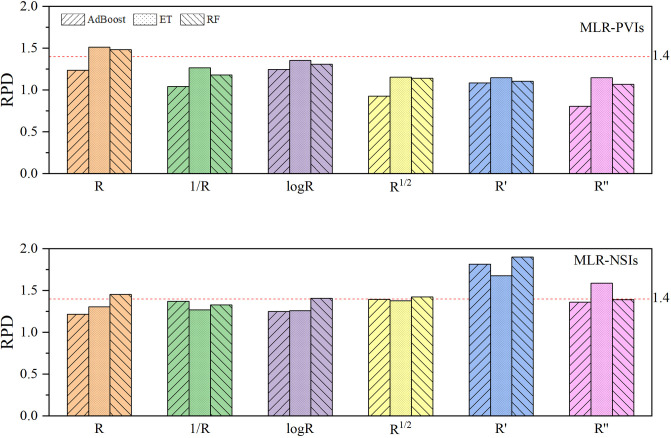
Fig 7. RPD distribution of the MLR-PVIs models and the MLR-NSIs models.
The RPD represents the ratio of the standard deviation (SD) of the measured LNC to the root mean square error of predicted LNC. The MLR-PVIs models and the MLR-NSIs models represent the machine learning regression models constructed by using the published vegetation indices and by using the new spectral indices. AdaBoost, ET and RF represent Adaptive Boosting models, Extra Trees models and Random forest models respectively. R, 1/R, logR, R1/2, R′ and R′′ represent original spectra, reciprocal spectra, logarithmic spectra, square root spectra, first-derivative and second-derivative spectra respectively.

