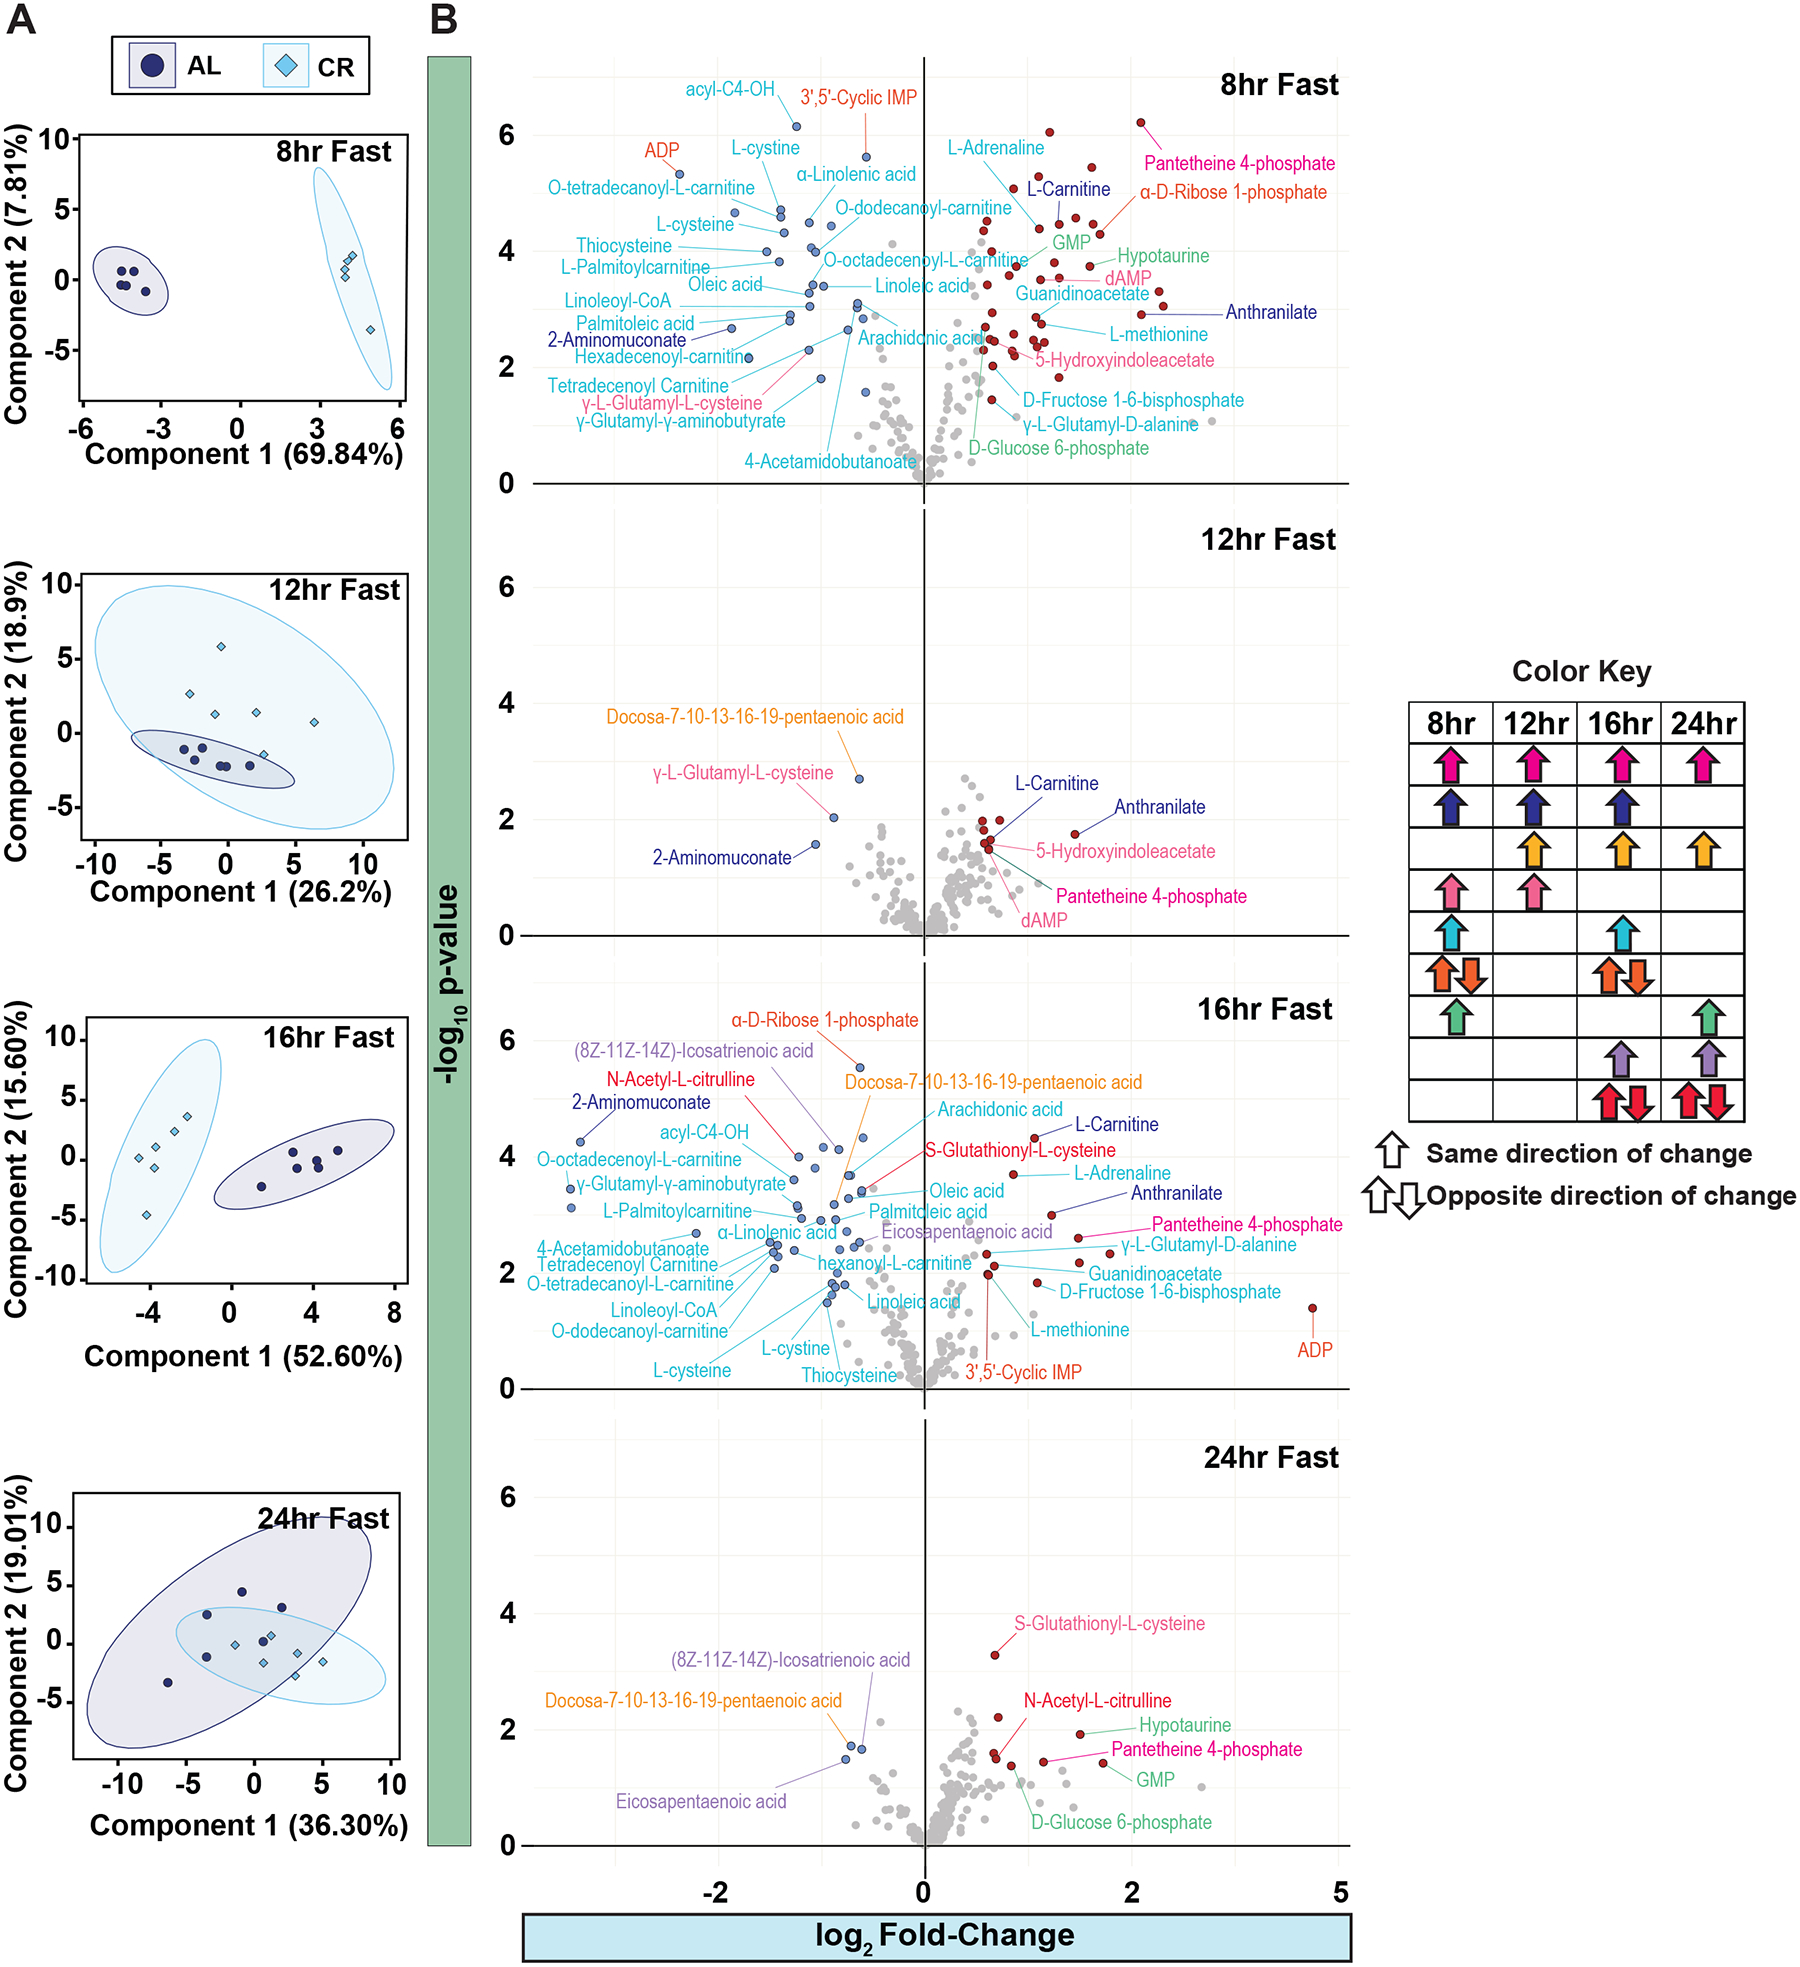
Figure 4. Plasma metabolite profile is dependent on time-of-day and diet.

(A) Untargeted metabolomics of plasma from male mice fed AL and CR diet from the Morning Study. PCA of plasma metabolites with AL and CR mice collected after an 8hr, 12hr, 16hr and 24hr fast. (B) Volcano plots of significantly increased plasma metabolites. Significantly decreased metabolites are colored blue and significantly increased metabolites are colored red. Metabolite names are colored coded based on significant change between AL and CR at more than one time point (color key). n = 5–6 mice per diet per time point. See also Supplementary Figures 10.
