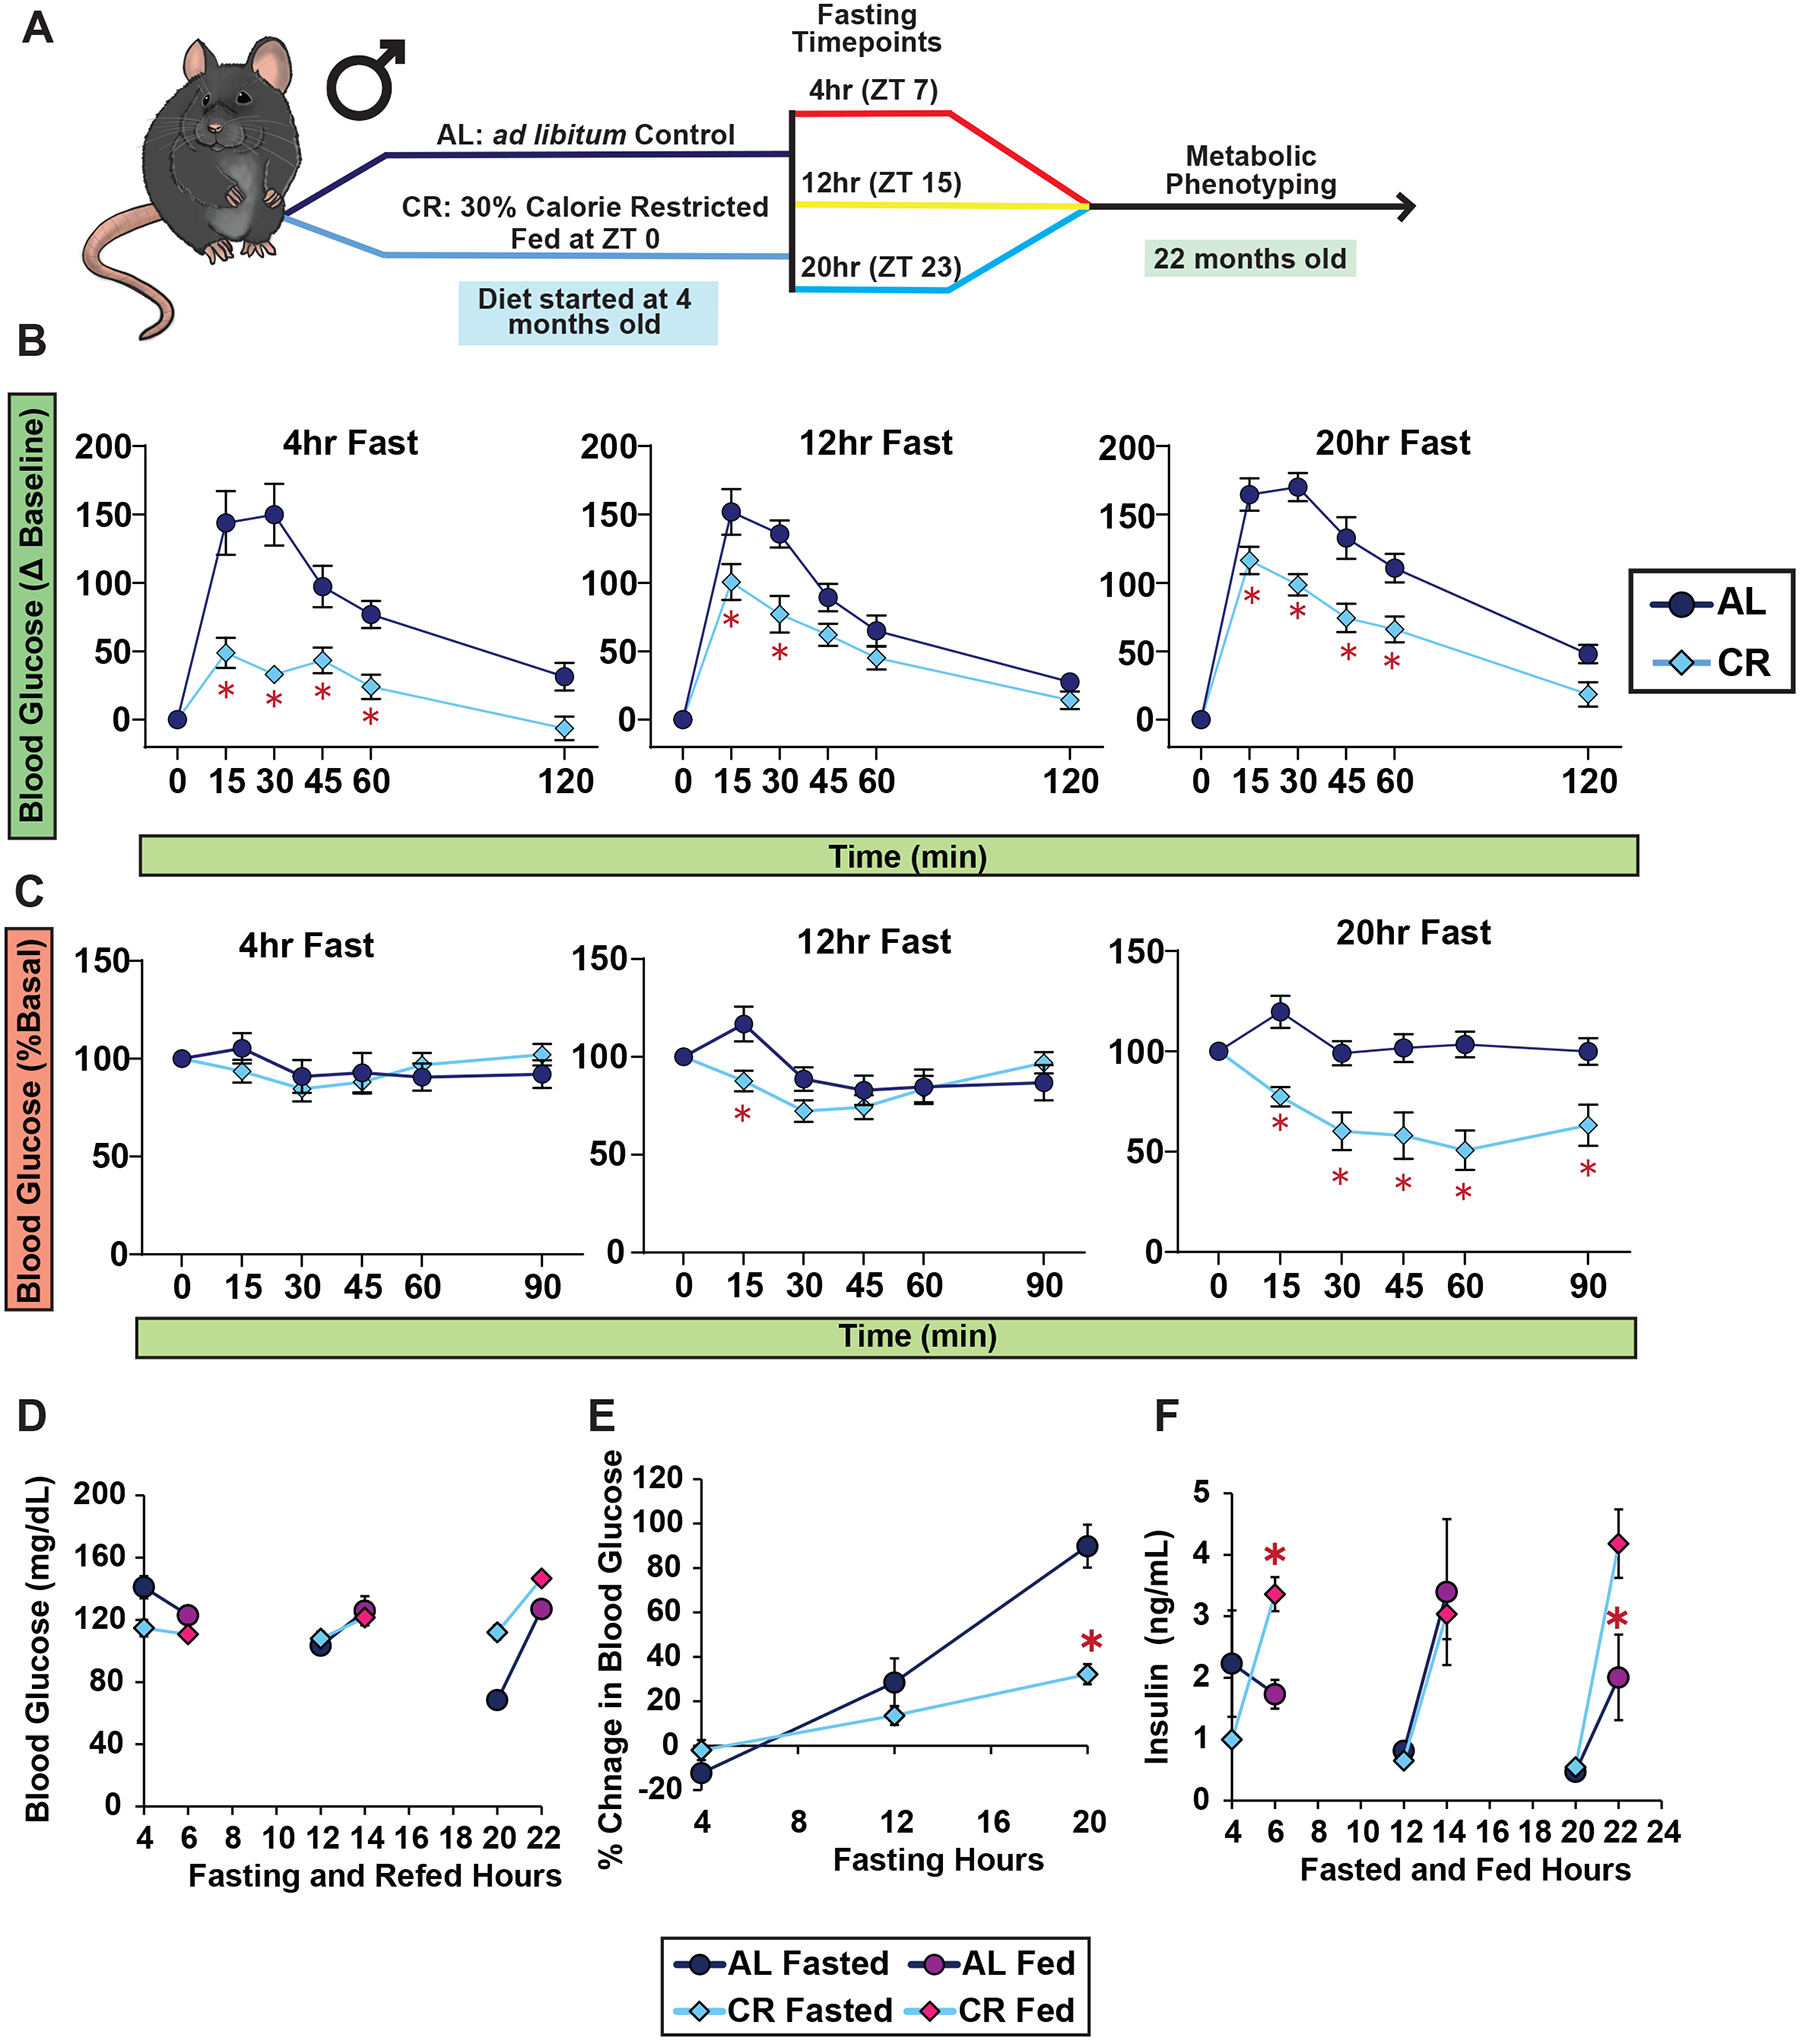
Figure 7. Morning-Fed aged males have similar response to glucose and insulin as young males.

(A) Schematic of GTTs and ITTs for 22-month-old male mice. (B-C) GTTs (B) and ITTs (C) conducted after fasts of varying lengths. (D-E) Blood glucose level of mice fasted for 4, 12, or 20 hrs, prior to and subsequent to feeding (D), and percent change in blood glucose level from fasted to fed state (E). (F) Plasma insulin level of mice fasted for varying lengths of time, prior to and subsequent to feeding. (B-F) n = 10 mice per diet per time point; *p<0.05 AL-fed vs. CR-fed mice at each time point, Sidak’s test post two-way repeated measures ANOVA. Data represented as mean ± SEM.
