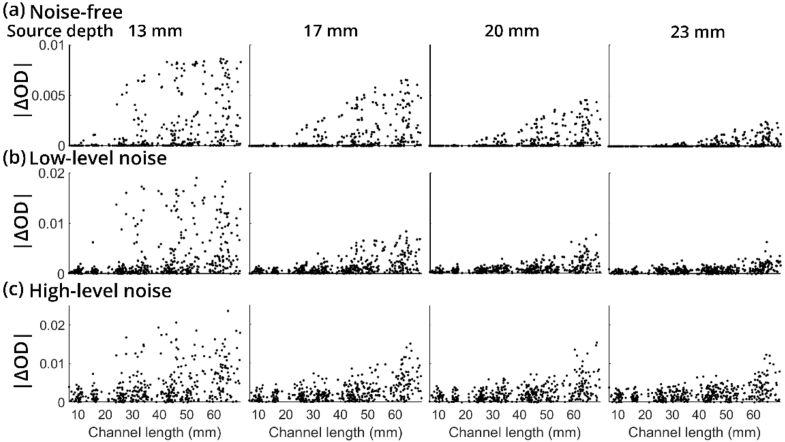
Fig. 3.
(a) Distribution of simulated DOT signals of four neural sources at different depths under the noise-free condition. X axis denotes DOT channel lengths and y axis denotes the absolute value of optical densities. (b) Distribution of simulated DOT signals of four neural sources at different depths under low-level noise. (c) Distribution of simulated DOT signals of four neural sources at different depths under high-level noise.

