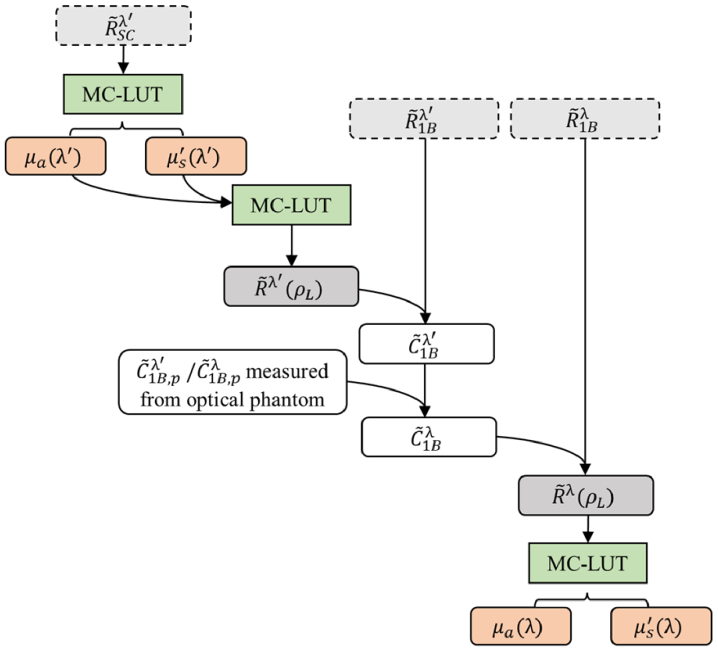
Fig. 2.
Flowchart depicting the data processing steps for the CWC approach. Light gray boxes with dashed lines indicate direct measurement quantities at wavelengths λ’ and λ, including self-calibrated complex reflectance , complex reflectance measured at source 1-detector B . Dark gray boxes indicate theoretical complex reflectance values for long source-detector distance ρL, . White boxes indicate calibration factors . Subscript “p” indicates values measured from a calibration phantom with known optical properties. Green boxes indicate Monte Carlo look-up table (MC-LUT) method as an inverse or forward model. Red boxes indicate absorption and scattering optical properties (µa and µs′, respectively) extracted from theoretical using MC-LUT.

