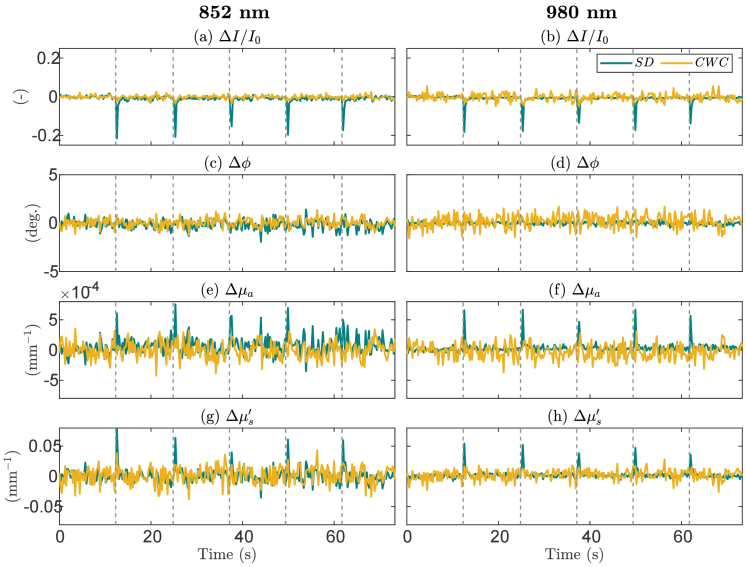
Fig. 5.
Time traces of normalized amplitudes (ΔI/I0, a, b), phase differences (Δϕ, c, d), relative absorption (Δµa, e, f) and reduced scattering coefficients (Δµs′, g, h) for single-distance (SD) and cross-wavelength calibrating (CWC) measurements with source 1 and detector B. Measurements were subtracted or normalized to first 5-second baseline data and were shown for wavelengths 852 nm and 980 nm. Vertical dashed lines indicate when pressure was applied on the probe. Spike-like distortion in the signals are observed in the SD signals.

