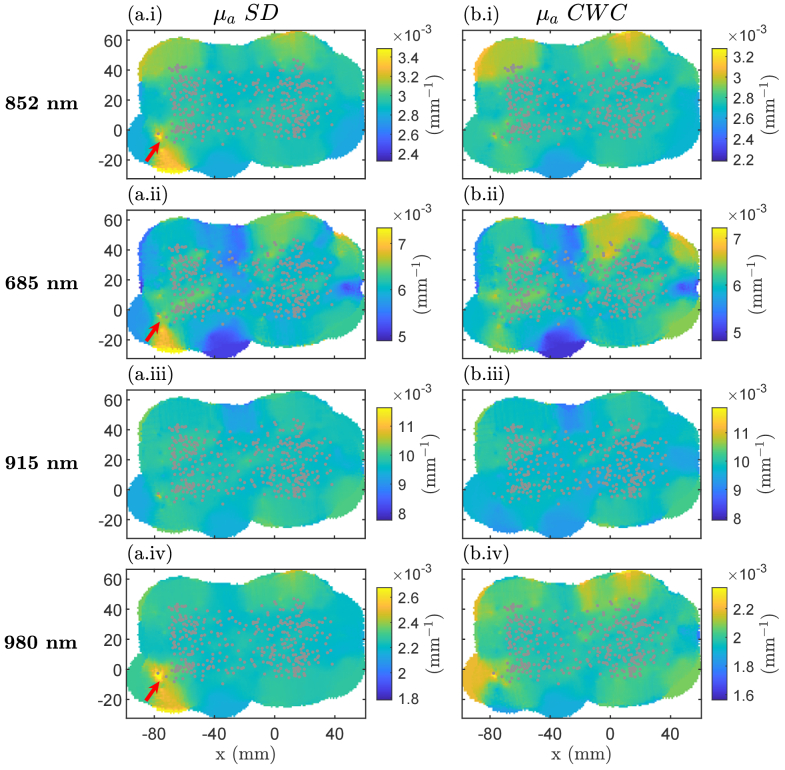
Fig. 6.
Two-dimensional images of estimated absorption coefficients (µa) from a homogeneous phantom. Data are displayed using weighted average-based visualization for (a) single distance (SD and for (b) cross-wavelength calibrating (CWC) measurements at source 1-detector B. Gray circles indicate the location of each measurement. Arrows indicate where the artifacts occurred during measurements at 852 nm, 915 nm, and 980 nm. Color bars are scaled between median value ± 20%.

